Parallel Computation - using the PARAVER tool on Data Star
1 Step 1: Login to Data Star................................................................................................................................................ 2
2 Step 2: Transfer program files to current
directory............................................................................................................ 2
3 Step 3: Running PARAVER on the Blue
Horizon............................................................................................................... 3
4 Step 4: Starting a PARAVER session................................................................................................................................... 3
5 Using Paraver........................................................................................................................................................................... 3
5.1 Definitions:...................................................................................................................................................................... 3
5.2 Paraver Interface Description:
(paraphrased from Paraver REFERENCE MANUAL)
........................................ 4
5.2.1 Window Descriptions........................................................................................................................................... 4
5.3 Module Descriptions..................................................................................................................................................... 5
5.3.1 Filter Module.......................................................................................................................................................... 5
5.3.2 Semantic Module................................................................................................................................................... 6
5.3.3 Representation Module........................................................................................................................................ 7
Paraver Quick Operation
1 Step 1: Login to Data Star
On LINUX or UNIX stations, first disable the access control using the command:
%
xhost +
This command gives permission to any x-client (Data Star in his case) to send files (or images) to your console. Login on the Data Star using the secure shell command:
%
ssh -lUserID dspoe.sdsc.edu
To use Paraver, the working node must be tf004i. If this is not the current node when you log in use the command rlogin tf004i to switch to this node.
2 Step 2: Transfer program files to current directory
The program files are located on the HPSS [High Performance Storage System]. To transfer the program modules to the Data Star, you have to use pftp. pftp is an ftp-like interface to HPSS. To do this, for the etch-paraver program for example, type:
tf004i
% pftp
pftp>
cd /users/csb/u4078
pftp>
get etch-paraver.tar
pftp>
quit
tf004i %
Next untar the program file:
tf004i
% tar xvf etch-paraver.tar
Change to the newly created directory (cd etch-paraver). In this directory a list of files similar to the following will be present: (to see contents of the current directory type ls)
etch.f input4
etchh.f out4
etchn.f script4
compile-etch
The file compile-etch is an executable script which sets up the environmental variables and compiles the program modules on the Data Star. etch.f, etchh.f and etchn.f are the etch modules, input4 contain the input parameters for the modules, and out4 is the output file.
The Paraver trace visualization tool requires a set of configuration files to be present in the current directory. Copy these files from their home directory using the following command:
tf004i % cp –r /usr/local/apps/paraver/cfg .
tf004i % cp –r /usr/local/apps/paraver/local/*cfg .
This adds the following directory and files to the current directory:
cfg/
user+parallel_functions.cfg
user_functions.cfg
3 Step 3: Running PARAVER on the Data Star
To compile the program, type the executable command:
tf004i % compile-etch
To run the etch program in batch
environment, your current directory has to be included in the script4
file, replacing the directory "/rmount/paci/ucsb/u4078/me140b/paraver/nobalance/etch-paraver".
[More information regarding the batch job environment can be found in Parallel
Computation - running in batch the Etching Problem on the Data Star].
To submit the job in the batch queues:
% llsubmit script4
Once a job is submitted, LoadLeveler assigns it a unique ID number.
An actual submit session might therefore look similar to the following:
     %llsubmit your_job_script
     submit: The job "tf174i.36727" has been submitted
To cancel the job, use the job ID with the llcancel command as shown.
%llcancel tf174i.36727
To obtain the status of the job shown previously issue the following.
%llq | grep ux.... where ux.... is your login name [see "man llq"].
A successful run of the program will be concluded by the presence of a file
with the suffix .prv, which is called a trace file.
4 Step 4: Starting a PARAVER session
To start a Paraver session, first define two variables: PWD and DISPLAY. PWD is your current directory name (to view it type pwd) and DISPLAY is the name of your UNIX/LINUX station (e.g. linux9).
tf004i % setenv PWD
/rmount/paci/ucsb/UserID/etch-paraver
tf004i % setenv DISPLAY linux9.engr.ucsb.edu:0.0
To start the Paraver session, type
tf004i
% $PARAVER_HOME/bin/paraver
etch20872.prv
The Paraver Visualizer Module, Global Controller, a trace window, and a menu bar open.
5 Using Paraver
5.1 Definitions:
Thread: A single sequential flow of control within a program. Threads are portions of a program or task that, once initialized, can execute semi-independently of other threads and processes. In distributed memory systems (such as B-H) threads do not communicate with each other. In shared memory systems, threads share address space within a task so they communicate and synchronize through shared memory.
Task: A portion of a program containing one or several threads. Tasks do not share address space, thus communication between them is done through message passing.
Ptask: The main program. Also called an application.
Processor: A single computing entity (microprocessor) within a CPU.
Node: A group of processors in a parallel network. A node (CPU) on Data Star is made of 8 processors, which have shared memory.
Trace: Information recorded from a program during its execution; composed of state transitions, events and communications with an associated time stamp. Parallel computation tools such as Paraver operate on a trace file through user-defined functions, creating visual displays of the information so that program efficiency can be qualitatively and quantitatively analyzed.
5.2 Paraver Interface Description: (paraphrased from Paraver REFERENCE MANUAL, http://www.npaci.edu/Horizon/paraver/docs/Paraver_MANUAL.pdf )
When Paraver starts, the screen will look similar to this:
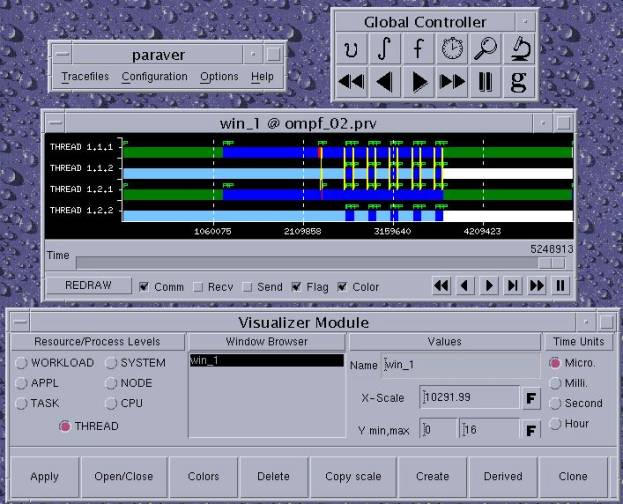
5.2.1 Window Descriptions
5.2.1.1 paraver
The paraver window contains the main menu items. The Tracefiles menu contains options for loading and unloading trace files, general trace file information, and the quit (and exit Paraver) option. The Configuration menu contains options for saving and recovering display window configurations. Configuration files are saved to and loaded from the current directory and are specific to the trace file. The Options menu contains options for changing system colors, scroll speed and search percentage (see Paraver manual for explanations).
5.2.1.2 Global Controller
The Global Controller window contains buttons for implementing Paraver functionality. There are three main levels of operation, or modules: the Filter module, “ f ”, the Semantic module, “ò”, and the Representation module. The Visualizer module, “v”, is part of the Representation module, as are the other nine buttons. These include a timing utility button for determining time intervals, a zooming utility, 1-D and 2-D analyzer buttons (not shown), and five buttons for playback viewing of the trace.
5.2.1.3 Displaying Window
This window is a graphical representation of the information output by the Semantic Module. The information displayed can be further modified by selections at the bottom of the window. Redraw the screen after each change. Right clicking over the window accesses other operations in the displaying window. The timing and zoom utilities are included here along with the scaling, saving, and color options. Zooming creates a new window with the new time scale.
The trace events are displayed as value evolutions in Gant timing diagram format. The event values are shown as either colors or as magnitudes (e.g. the event “Waiting a message” is shown in red or as value 3). Select the “Color” checkbox in the Display window to turn colors off and on (remember to redraw). Click on the “Colors” button in the Visualizer window to view the legend.
Left clicking on the display window brings up another window labeled “What/Where Information.” Also referred to as the textual module, this window contains detailed, quantitative information about the selected event and time. This window has several options for further modifying the information.
5.2.1.4 Visualizer Module
This window is the interface for modifying the display window. It contains tools for creating and deleting display windows, changing the process level displayed (thread, task, application, etc.), changing scale, time units, and colors, and an assortment of other viewing options. A more detailed description is provided below.
5.3 Module Descriptions
5.3.1 Filter Module
This module works directly on the trace file. By filtering unneeded data, it provides the Semantic module a partial view of the trace file. The user can specify which communications and user events are passed so that only essential information is displayed. The filter module has two main areas: to filter communications and/or user events.
5.3.1.1 Communications
Paraver has two types of communications: logical (when send/receive functions are called) and physical (when
messages are actually sent/received). The user can choose to filter either type, or both, at the top of the module window. By default Paraver filters only the physical communications.
The next communications filter level is by partners and by messages. Filtering messages by partners means filtering messages that are passed between two or more rows (depending on the current display window, a row is a thread, task, application, etc.). Specify which rows to filter messages ‘to’ and/or ‘from’ by clicking the ‘?’ beside the text boxes. The functions to select partners are:
All : all the current items will be selected
!= : select all the current items but ones written in the text box
= : only select the items written in the text box
None : no items will be selected
Filtering communications by messages means filtering messages with specified tags and/or sizes. The tags/sizes must be written in the text box separated by colons. When both partners and messages filtering processes are selected, Paraver will draw the communication traces that accomplish both conditions. The functions to select messages are (in addition to the functions for partners):
> : select all the items greater than ones written in the text box
< : select all the items less than ones written in the text box
5.3.1.2 User Events
User events are filtered by type and/or value. Each type of user event has a list of possible values, and this information is displayed by clicking the ‘?’ beside the text boxes. Functions for selecting user events are the same as those for selecting partners and messages, plus one more:
[x,y] : select all the user events whose type/value is within the interval
After modifying the filtering selection, the changes can be applied to the current window by clicking the “Redraw” button.
5.3.2 Semantic Module
This module takes the information from the Filter module and computes values to be passed on to the Representation module. It looks at the coding of the state trace records and the process model semantics, and uses one function for each level (PTASK, TASK, CPU, THREAD) to generate values. Functions are applied in levels from the bottom up, with THREAD being the first level. Functions include:
THREAD (3 categories, choose only one function):
· State:
Useful: returns a 1 if state value is 1 (Running), 0 if state value is otherwise
State sign: returns a 1 if state value is not 0 (idle), 0 if state value is 0
State as is: returns the state value as is
Given state: returns states as is for selected states, 0 for states not selected
In state: returns 1 for selected states, 0 for states not selected
Not in State: returns 0 for selected states, 1 for states not selected
· Event:
Last Evt Type: returns current event trace value
Last Evt Val: returns current event trace type
Next Evt Type: returns next event trace value
Next Evt Val: returns next event trace type
Avg Next Evt Val: returns the next event trace value times a factor, divided by the time interval
Avg Last Evt Val: returns the current event trace value times a factor, divided by the time interval
Given Evt Val: returns current event trace value for selected events, 0 for events not selected
In Evt Val: returns 1 for selected events, 0 for events not selected
Int. Between Evt: returns the time between current event trace and next event trace
· Communication
Last Size: if communication trace is a physical receive, returns its message size
Last Tag: if communication trace is a physical receive, returns its message tag
CPU:
Adding: adds all the input values and returns the sum
Adding sign: adds all the input values and returns a running state (value 1) if the sum is greater than zero.
Otherwise, returns the idle state (value 0)
Average: returns the average of the input values
Maximum: returns the maximum of all the input values
Minimum: returns the minimum of all the input values
TASK:
Same functions as CPU level plus
Thread i: takes all the input values and returns the value of the thread i. If thread i does not exist within a
task, the value 0 is returned for this task.
PTASK:
Same functions as CPU level
Depending on the type of functions selected, Paraver disables levels that are not needed for the computation. For example, at CPU level, only functions in CPU and THREAD levels are used. PTASK and TASK functions are disabled.
For added flexibility, above the process model functions are two COMPOSE functions, applied from the bottom up. Each COMPOSE level has the same functions, which can be combined to further modify the value. The COMPOSE functions are:
As is: return values from previous level unchanged
Sign: returns value 1 (running state) if the value from the previous level is greater than zero and 0 (idle
state) if the previous value is negative or zero.
1-Sign: complementary of sign function. Returns 0 if the value is positive and 1 otherwise.
The power of Paraver lies in the how the user combines the functions in the Semantic module to generate values relevant for analysis.
5.3.3 Representation Module
The Representation module is composed of three modules: the visualization module, the textual module, and the analyzer module. The visualization module is composed of the displaying windows, which give a graphical representation of the trace file, and the visualizer module. The textual module provides a textual representation of the trace file around specified points (also called the “What/Where Information” window, see above). The analyzer module, brought up by clicking the ‘microscope’ icons in the Global Controller, provides summarized information about the trace file.
5.3.3.1 Visualization Module
In the visualization module, display windows are created, customized and deleted using the visualizer module. The visualizer module, if not already displayed, is opened by selecting the “v” icon in the Global Controller. Upon startup, the visualizer module and one display window is shown in default configuration.
The visualizer module contains five main areas and a group of buttons to manage the displaying windows. The five main areas are for specifying parameters in the display window.
· On the far left is the ‘Resource/Process Levels’ area, which is used to select which level of the trace file to display (application, task, thread, etc.). The ‘Resource/Process Levels’ button at the top of this area brings up a window for renaming of the objects, for selecting which objects to show, etc.
· The ‘Window browser’ area allows for selecting, and switching between, display windows when multiple display windows are open.
· The ‘Values’ area provides text boxes for renaming and changing the scale of the active display window. Clicking the ‘values’ button once clears all values, and clicking twice resets all values to their default.
· The ‘Time Units’ area provides several options for changing the time units.
· The ‘Tracefile’ area allows for easy switching between trace files when multiple trace files are open.
The buttons on the bottom of the window are for managing the display windows. They include:
· ‘Apply’: applies the parameters specified in the five main areas to the current display window. The current display window is highlighted in the window browser.
· ‘Open/Close’: opens and closes the current display window.
· ‘Colors’: brings up a color legend and tools for modifying colors.
· ‘Delete’: deletes the current display window.
· ‘Copy scale’: copies the scale of the current window and applies it to the next window selected in the window browser.
· ‘Create’: creates a new display window with all the settings specified in the five main areas.
· ‘Derived’: [apparently] creates a new display window using settings shared between two congruent windows, as selected in the window browser.
· ‘Clone’: creates a clone of the current display window.
· ‘Events’: brings up a window containing a list of event types shown in the display window
· ‘Okay’: closes the visualizer module.
5.3.3.2 Textual Module
The textual module is opened by left clicking over any part of the trace in the display window. This brings up a window containing a description of all events in the vicinity of the selected point. The object and the time selected are shown at the top of the list of information.
The list includes three types of information: semantic values, events and communications. The format for each type is:
Semantic: Semantic value: value Duration: burst duration
Event: User Event at time Type is type Value is value
Communication: Logical/Physical SEND/RECEIVE at time to/from object at time, Duration:
communication time (Transmission = real time of message transferring), (size: message size, tag: message tag)
The tools at the bottom of the screen are for managing the information displayed. They include:
· ‘Semantic’, ‘Events’ and ‘Communication’: specify the types of information to be listed.
· Scale bar: to adjust the width of the click selection in current time units. Paraver multiplies the X-scale of the display window by the scale bar number to compute the width. Re-click on the display window to see the change.
· ‘All the burst’: when checked, the click selection will include all information related to the burst. This is useful when the amount of activity around the click selection is sparse (i.e. when the display window has a low scale, i.e. zoomed in).
· ‘Hex Mode’: a new function not described in the current manual.
· ‘Text Mode’: when disabled, the semantic value, user event type and user event value are listed as their assigned numerical values instead of their textual description.
· ‘Repeat’: repeats the last click on the display window, effectively refreshing the textual module and enacting any previous changes.
· ‘Save as Text’: opens a window to allow the user to save the listed information to a file in the current directory.
· ‘Ok’: closes the textual module.
5.3.3.3 Analyzer Module
The analyzer module works on the information contained in the display windows, and is opened by selecting the 1-D or 2-D ‘microscope’ icons in the global controller. After the module window opens, the user is prompted to select a display window and a region within it to be analyzed. The following description applies to the 1-D analyzer module, as the 2-D analyzer is not described in the manual.
The analyzer module can show four analyses of a region at the same time, one in each of the four middle columns. A list of standard functions is provided at the top of each column. These include functions such as # Sends, # Receives, # Events, etc. At the bottom of each column is an option to display the data as text or in bar graph form.
The far right column displays the analysis limits and duration, and contains tools for managing the analyzer module. The tools include, starting from the bottom:
· ‘Calculate All’: when enabled, this makes it so results for all analyzer functions—not just the four selected functions—are computed. This saves time when it is necessary to switch between many functions for the selected region. For large trace files where computation is slow, and when only interested in a few functions, it is a good idea to disable the Calculate All option.
· ‘Repeat’: repeats all selected functions (and every function if the Calculate All option is enabled) on the current region.
· ‘Analyze’: brings up the cursor when the mouse is moved over a display window so that a new region can be selected and analyzed.
· ‘All Window’: makes the analysis region the entire area of the current display window.
· ‘All Trace’: makes the analysis region the entire trace file (the entire area of the original display window).
· ‘Save’: opens a window to allow the user to save the analyzer window in the current directory.
· ‘Ok’: closes the analyzer module.
Paraver also includes the flexibility for creating custom analyzer functions. For information on creating custom functions the reader is referred to the online manual. Very detailed, qualitative and quantitative analysis can be performed by appropriately combining the Filter, Semantic, and Analyzer module functions.