VAMPIR is a trace collection library and visualization tool for programs that use MPI communication, either hand-written or as generated by a compiler or preprocessor. As with all trace collection tools, time stamped records of the program's state are collected at runtime. VAMPIR has three components:
    * The VAMPIR tool itself is a graphical event trace browser implemented for the X11 window
      system using the Motif toolkit.
    * The VAMPIR runtime library provides an API for collecting, buffering, and generating event
      traces as well as a set of wrapper routines for the most commonly used MPI and PVM
      communication routines which record message traffic in the event trace.
    * In order to observe functions or subroutines in the user program, their entry and exit
      have to be instrumented by inserting calls to the VAMPIR runtime library.

      VAMPIR comes with a source instrumenter for Fortran 77. Programs written in other
      programming languages (C or C++) have to be instrumented manually.
During the execution of the instrumented user program, the VAMPIR runtime library records
entry and exits to instrumented user and message passing
    * The dynamic behavior of the program can be analyzed by timeline diagrams for either the
      whole program or a selected set of nodes. By default, the displays show the whole event
      trace, but the user can zoom-in to any arbitrary region of the trace. Also, the user
      can change the display style of the lines representing messages based on their
      tag/communicator or the length. This way, message traffic of different modules or
      libraries can easily be visually separated.

    * The parallelism display shows the number of nodes in each function group over time. This makes it easy to
      locate specific parts of the program, e.g., parts with heavy message
      traffic or I/O.

    * VAMPIR also provides a large number of statistical displays. It calculates how often each
      function or group of functions was called and the time spent doing this. Message statistics
      show the number of messages sent, and the minimum, maximum, sum, and average length or
      transfer rate between any two nodes. The statistics can be displayed as barcharts,
      histograms, or textual tables.

    * If the instrumenter/runtime library provides the necessary information in the event trace
      header, the information provided by VAMPIR can be related back to the source. VAMPIR
      provides a source code and a call graph display to show selected functions or the location
      of the send and the receive of a selected message.
In the Summary Chart , VAMPIR is a very powerful and highly configurable event trace browser. It
displays trace files in a variety of graphical views, and
    * compile the program with the -g option
    * link the ".o" files with the VAMPIR library [see the Makefile]
    * run the program to generate a VAMPIR trace file
    * start the VAMPIR session
The VAMPIR main window:


    * Summary Chart
    * Activity Chart
from the main window menu is a good starting point in understanding the utilization of VAMPIR.
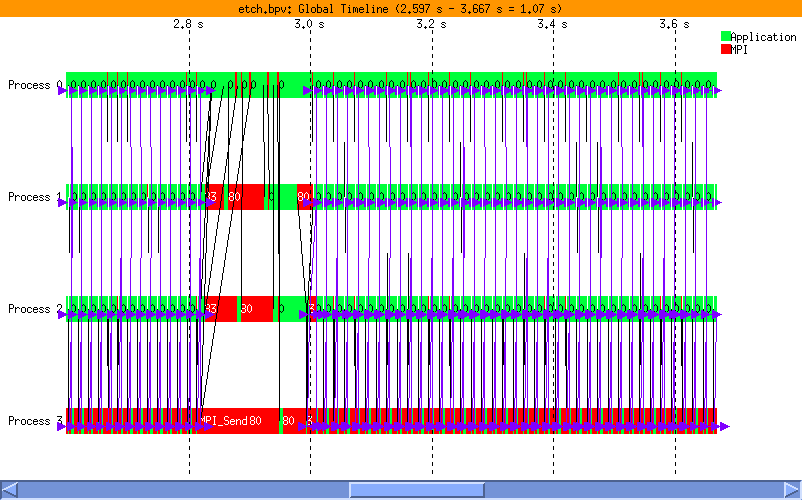
      Global Timeline Display :
    For each process, the display shows the different states and their change over execution time
along a horizontal time axis. Messages between processes are indicated as lines connecting the
sending and receiving processes.
    By default, the timeline view shows the whole execution trace. Even with smaller traces this will
lead to a cluttered display like that shown in the figure above. To concentrate on a special part of
the trace file please invoke the VAMPIR zooming function by selecting an area of interest with your
mouse. To zoom into a part of the timeline view, move the the mouse pointer to the start of the
interval you want to zoom into, press the left mouse button, drag the mouse to the
end of the zoom interval while keeping the left mouse button down (only the x-coordinate matters).
VAMPIR will indicate the marked region with rubber-bands. Finally, release the mouse button. The
timeline display will be redrawn showing just the time interval you selected, with the contents
magnified accordingly.
    You can repeatedly zoom into arbitrary levels of detail. Zooming out step-by-step can be done
with the Undo Zoom function of the context menu.
    The  Global Displays/Timeline view is the central display of VAMPIR because all other global and process
specific statistic displays can be configured to use only the portion of time the timeline view
displays. This option can be selected for a single display by selecting  Timeline  from
the appropriate context menu.

    Summary Chart Display:
    The Summary Chart display shows the sum of the time consumed by all instrumented activities over
all selected processes. This is analogous to the information displayed by conventional profilers.
By default, the Summary Chart display shows a horizontal bar chart of those activities that occur
in the time interval displayed in the window's top line. To get a statistic of a specific time
interval activate the option  Timeline from the context menu. Now an arbitrary time
interval can be chosen in the timeline display.
     By default the view shows how much time was used for the application program, and how much time
was used by MPI calls. An interesting question is now, which MPI functions uses  most of the
runtime? To break  down the time used by the activity "MPI" into the time used by single MPI
functions open the context menu by placing the pointer inside the window and pressing the right button
 and select Display/MPI . Now the
display shows all traced MPI functions and the time spent inside.
     To generate an average per process statistic, open the context menu and select Options/Per
Process. All times are now divided by the number of processes.

      Activity Chart Display:
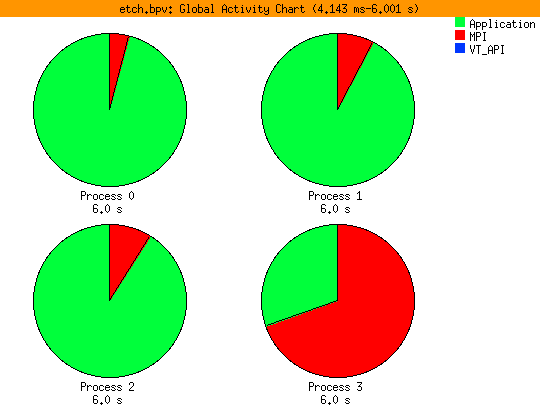
    The Global Displays/Activity Chart display  shows a statistic
about the time spent in each activity individually for each process defined in the tracefile. Its
default appearance is show below:


    With the default pie chart display you can recognize the load imbalance at a glance in the traced
program by comparing the different time consumption of activities over all processes. VAMPIR can assist
the user by visualizing the actual trace data in different chart modes. Depending on the users
preference the activity chart can be switched to the so called "Histogram" mode.
    To focus on a single activity, for instance MPI, please open the context menu with
the right mouse button click inside the Activity Chart and select the activity MPI from the Display menu
cascade. A new set of pie charts is drawn, showing only the symbols of the selected activity MPI. So you
can compare different activities or symbols of all processes.
To login on the Data Star you must use the secure shell command in a LINUX environment:
% ssh -lUserID dslogin.sdsc.edu
To transfer the etch program and auxiliary files to the Data Star, you have to use pftp. pftp is an ftp-like
interface to HPSS. The followings links and text below describe how to use the pftp utility:% pftp pftp> cd /users/csb/u4078 pftp> get etch-vamp.tar pftp> quit %
In order to compile and run the etch program, you have to untar the file etch-vamp.tar:
%tar xvf etch-vamp.tarIn the directory etch-vamp, the following files will be present:- Makefile - etch.f - etchh.f - etchn.f - input4In order to compile the etch program, change to the etch-vamp directory and run make:% cd etch-vamp % make
To run the etch program you must be logged on into the so-called interactive nodes:
% ssh -lUserID dspoe.sdsc.eduTo run the etch program with the VAMPIR tool, set the paths to the VAMPIR tool:% set PAL_ROOT=/usr/local/apps/vamp % set PAL_LICENSEFILE=/usr/local/apps/vamp/license.dat % set path = ($path /usr/local/apps/vamp/bin)and then invoke the parallel program using the poe command-line flags:% poe etch -nodes 4 -tasks_per_node 1 -rmpool 1 -euilib ip -euidevice en0 The file "input4" must be in the directory in which you are running etch.The program executes, generating a trace file called etch.bpv.
After the program has finished executing, start a VAMPIR session:
         Set the DISPLAY variable to the name of the machine you are logged into
         [for example "linux9"]:
             % setenv DISPLAY linux9.engr.ucsb.edu:0.0
         Enter:
             % vampir etch.bpv
The VAMPIR Main window and the Global Timeline Display window open.
To do this, click on the Global Displays from the main window and open:
         * Summary Chart
         * Activity Chart
You can select any other views. To interpret the information these windows present, see VAMPIR User Guide.
We'll start by viewing the time for the entire run. Zoom in on a section of the timeline:
    * Click and drag over a portion of the timeline with the left mouse.
      This part will be magnified.
    * Continue zooming until most of the MPI function names are revealed.
From the Global Display menu, select Summary Chart view. A new view will open. Press the right mouse button within this window.
     * Select the Use Timeline Portion.
     * Scroll the timeline, using the scroll bar at the bottom of the timeline
       window, and watch what happens in both displays.
The "Activity Chart" display shows a statistic about the time spent in each activity individually for each process defined in the tracefile. With the default pie chart display you can recognize load imbalance at a glance in the trace program by comparing the different time consumptions of the activities over all processes.
To do this, select:
File --> Exit