% Copyright (C) 2001, James B. Rawlings and John G. Ekerdt
%
% This program is free software; you can redistribute it and/or
% modify it under the terms of the GNU General Public License as
% published by the Free Software Foundation; either version 2, or (at
% your option) any later version.
%
% This program is distributed in the hope that it will be useful, but
% WITHOUT ANY WARRANTY; without even the implied warranty of
% MERCHANTABILITY or FITNESS FOR A PARTICULAR PURPOSE. See the GNU
% General Public License for more details.
%
% You should have received a copy of the GNU General Public License
% along with this program; see the file COPYING. If not, write to
% the Free Software Foundation, 59 Temple Place - Suite 330, Boston,
% MA 02111-1307, USA.
%
% rate_estimation.m
%
stoi=[0 1 0 -1 -1 1; -1 1 1 -1 0 0; 1 0 -1 0 -1 1];
r=[1;2];
A=stoi(1:2,:);
R=A'*r;
%
% set seed for "reproducible" random numbers
%
randn('seed',0)
%
% lots of noisy points
%
npoints=2000;
Rmeas = zeros (6, npoints);
for i=1:npoints Rmeas(:,i)=0.05*randn(6,1)+R; end
rest=(inv(A*A')*A * Rmeas)';
save -ascii rate_estimation_app.dat rest;
if (~ strcmp (getenv ('OMIT_PLOTS'), 'true')) % PLOTTING
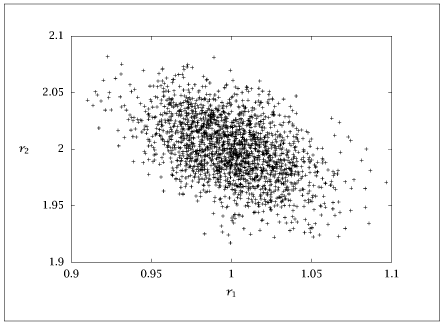
plot (rest(:,1), rest(:,2), '.');
axis ([0.9, 1.1, 1.9, 2.1]);
% TITLE
end % PLOTTING
