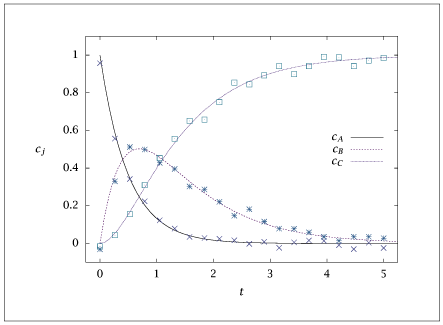
Figure A.10:
Fit of model to measurements using estimated parameters.

Code for Figure A.10
Text of the GNU GPL.
main.m
1
2
3
4
5
6
7
8
9
10
11
12
13
14
15
16
17
18
19
20
21
22
23
24
25
26
27
28
29
30
31
32
33
34
35
36
37
38
39
40
41
42
43
44
45
46
47
48
49
50
51
52
53
54
55
56
57
58
59
60
61
62
63
64
65
66
67
68
69
70
71
72
73
74
75
76
77
78
79
80
81
82
83
84
85
86
87
88
89
90
91
92
93
94
95
96
97
98
99
100
101
102
103
104
105
106
107
108
109
110
111
112
113
114 | %
% Estimate parameters for the A->B->C model using paresto.m
% jbr, 4/2018
%
% updated to paresto.m interface, 12/2019
%Model
% This m-file loads data file 'ABC_data.dat'.
model = struct;
model.print_level = 1;
model.transcription = "shooting";
%model.nlp_solver_options.ipopt.linear_solver = 'ma27';
model.nlp_solver_options.ipopt.mumps_scaling = 0;
model.x = {'ca', 'cb', 'cc'};
model.p = {'k1', 'k2'};
% measurement list
model.d = {'m_ca', 'm_cb', 'm_cc'};
model.ode = @massbal_ode;
ncase = 1;
switch ncase
case 1
% fit A,B,C
model.lsq = @(t, y, p) {y.ca-y.m_ca, y.cb-y.m_cb, y.cc-y.m_cc};
nmeas = [1;2;3];
case 2
% fit A only
model.lsq = @(t, y, p) {y.ca-y.m_ca};
nmeas = [1];
case 3
% fit B only
model.lsq = @(t, y, p) {y.cb-y.m_cb};
nmeas = [2];
case 4
% fit C only
model.lsq = @(t, y, p) {y.cc-y.m_cc};
nmeas = [3];
otherwise
error ('ncase out of range: %f\n', ncase)
end%switch
tfinal = 6;
nplot = 75;
tplot = linspace(0, tfinal, nplot)';
% For reference; actual parameters generating data (see ABC_data.m)
k1 = 2; k2 = 1;
ca0 = 1; cb0 = 0; cc0 = 0;
% load measurements from a file
tabledat = load ('ABC_data.dat');
tmeas = tabledat(:,1);
ymeas = tabledat(:,2:4);
[tout,~,ic] = unique([tmeas; tplot]);
% index of times at which measurement is made
meas_ind = ic(1:numel(tmeas));
model.tout = tout;
% interploate measurement onto new grid
y_noisy = interp1(tmeas, ymeas, tout, 'previous');
y_noisy(isnan(y_noisy)) = 0.;
model.lsq_ind = meas_ind'; % only use index of measurement times in objective function
% Create a paresto instance
pe = paresto(model);
% parameters; initial guesses and bounds;
thetaic.k1 = 0.5;
thetaic.k2 = 3;
thetaic.ca = ca0;
thetaic.cb = cb0;
thetaic.cc = cc0;
lb.k1 = 1e-4;
lb.k2 = 1e-4;
lb.ca = ca0;
lb.cb = cb0;
lb.cc = cc0;
ub.k1 = 10;
ub.k2 = 10;
ub.ca = ca0;
ub.cb = cb0;
ub.cc = cc0;
% estimate the parameters
est = pe.optimize(y_noisy', thetaic, lb, ub);
% Also calculate confidence intervals with 95% confidence
conf = pe.confidence(est, 0.95);
disp('Estimated parameters')
disp(est.theta)
disp('Bounding box intervals')
disp(conf.bbox)
%plot the model fit to the noisy measurements
if (~ strcmp (getenv ('OMIT_PLOTS'), 'true')) % PLOTTING
figure()
plot(model.tout, est.x(nmeas,:)', tmeas, ymeas(:,nmeas), 'o');
if (ncase ~= 1)
figure()
plot(model.tout, est.x', tmeas, ymeas, 'o');
end
% TITLE
end % PLOTTING
tableest = [model.tout, est.x'];
save ABC.dat tableest tabledat
|
ABC_data.dat
1
2
3
4
5
6
7
8
9
10
11
12
13
14
15
16
17
18
19
20 | 0.000 0.957 -0.031 -0.015
0.263 0.557 0.330 0.044
0.526 0.342 0.512 0.156
0.789 0.224 0.499 0.310
1.053 0.123 0.428 0.454
1.316 0.079 0.396 0.556
1.579 0.035 0.303 0.651
1.842 0.029 0.287 0.658
2.105 0.025 0.221 0.750
2.368 0.017 0.148 0.854
2.632 -0.002 0.182 0.845
2.895 0.009 0.116 0.893
3.158 -0.023 0.079 0.942
3.421 0.006 0.078 0.899
3.684 0.016 0.059 0.942
3.947 0.014 0.036 0.991
4.211 -0.009 0.014 0.988
4.474 -0.030 0.036 0.941
4.737 0.004 0.036 0.971
5.000 -0.024 0.028 0.985
|
massbal_ode.m
| function xdot = massbal_ode(t, x, p)
r1 = p.k1*x.ca;
r2 = p.k2*x.cb;
xdot = {-r1, r1-r2, r2};
|
