% Copyright (C) 2001, James B. Rawlings and John G. Ekerdt
%
% This program is free software; you can redistribute it and/or
% modify it under the terms of the GNU General Public License as
% published by the Free Software Foundation; either version 2, or (at
% your option) any later version.
%
% This program is distributed in the hope that it will be useful, but
% WITHOUT ANY WARRANTY; without even the implied warranty of
% MERCHANTABILITY or FITNESS FOR A PARTICULAR PURPOSE. See the GNU
% General Public License for more details.
%
% You should have received a copy of the GNU General Public License
% along with this program; see the file COPYING. If not, write to
% the Free Software Foundation, 59 Temple Place - Suite 330, Boston,
% MA 02111-1307, USA.
%
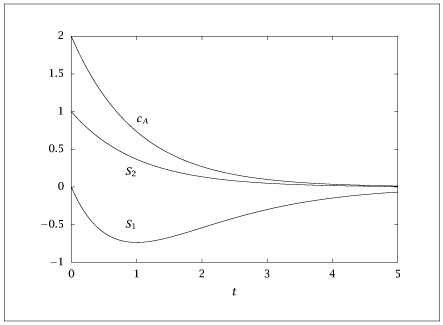
% Illustrate sensitivity calculation in simple first-order reaction
%
% dca/dt = -k ca
% ca(0) = ca0
%
% theta = [k; ca0]
%
% compute solution to model
% and sensitivities
%
% ca(t)
% S1 = d ca / d k
% S2 = d ca / d ca0
%
% ca(t) = ca0 exp(-kt)
% S1 = -t ca0 exp(-kt)
% S2 = exp(-kt)
%
% jbr, 10/5/01
%
% converted from ddasac to cvodes, 3/31/07, jbr
%
% converted to use paresto, 5/1/2018, jbr
%
ca0 = 2;
k = 1;
tfinal = 5;
nts = 100;
tout = linspace(0,tfinal,nts);
model = struct;
model.transcription = 'shooting';
model.x = {'ca'};
model.p = {'k'};
model.d = {'m_ca'};
model.tout = tout;
model.ode = @(t, y, p) {-p.k*y.ca};
% fit the perfect measurement data
model.lsq = @(t, y, p) {y.ca-y.m_ca};
pe = paresto(model);
% initialize state and parameters
x0 = ca0;
y_ac = pe.simulate(0, x0, k);
theta0 = struct();
theta0.k = k;
theta0.ca = ca0;
lb.k = theta0.k;
lb.ca = theta0.ca;
ub.k = theta0.k;
ub.ca = theta0.ca;
[est, y, p] = pe.optimize(y_ac, theta0, lb, ub);
table = [tout(:), y.ca(:), est.dca_dk(:), est.dca_dca0(:)];
save -ascii Sfirstorder.dat table;
% if (~ strcmp (getenv ('OMIT_PLOTS'), 'true')) % PLOTTING
plot (tout, [y.ca', est.dca_dk, est.dca_dca0]);
% % TITLE
% end % PLOTTING
