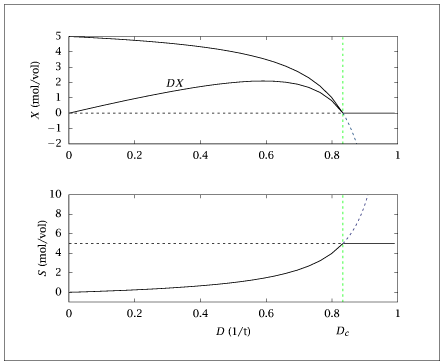
Figure 10.12:
The two steady-state biomass and substrate concentrations versus dilution rate; stable (solid), unstable (dashed).

Code for Figure 10.12
Text of the GNU GPL.
main.m
1
2
3
4
5
6
7
8
9
10
11
12
13
14
15
16
17
18
19
20
21
22
23
24
25
26
27
28
29
30
31
32
33
34
35
36
37
38
39
40
41
42
43
44
45
46
47
48
49
50
51
52
53
54
55
56
57
58
59
60
61
62
63 | % straighten out the chemostat
%
% Revised 8/16/2018
mum = 1;
D = 1.05;
Ks = 1;
Sf = 5;
y = 1;
Dopt = mum*(1 - sqrt(Ks/(Ks+Sf)))
Dc = mum*Sf/(Ks+Sf)
nDs = 25;
Dvec1 = linspace (0.001, Dc, nDs)';
for i = 1:nDs
D = Dvec1(i);
%compute eigenvalues of jacobian for both steady states
%first steady state is washout
xs11(i,:) = [0, Sf];
Ss = D*Ks/(-D + mum);
xs21(i,:) = [y*(Sf-Ss), Ss];
lam1(i,:) = sort(eig(jacob(xs11(i,:), mum, D, Ks, Sf, y)));
lam2(i,:) = sort(eig(jacob(xs21(i,:), mum, D, Ks, Sf, y)));
end
Dmax = Dc;
Dvec2 = linspace (Dc, 0.99, nDs)';
for i = 1:nDs
D = Dvec2(i);
%compute eigenvalues of jacobian for both steady states
%first steady state is washout
xs12(i,:) = [0, Sf];
Ss = D*Ks/(-D + mum);
xs22(i,:) = [y*(Sf-Ss), Ss];
lam12(i,:) = sort(eig(jacob(xs12(i,:), mum, D, Ks, Sf, y)));
lam22(i,:) = sort(eig(jacob(xs22(i,:), mum, D, Ks, Sf, y)));
end
% compute production rate
DX1 = Dvec1.*xs21(:,1);
DX2 = Dvec2.*xs22(:,1);
table1 = [Dvec1, xs11, xs21, DX1];
table2 = [Dvec2, xs12, xs22, DX2];
save "chemoss.dat" table1 table2
if (~ strcmp (getenv ('OMIT_PLOTS'), 'true')) % PLOTTING
subplot(2,1,1)
plot(table1(:,1), [table1(:,2), table1(:,4), table1(:,6)], ...
table2(:,2), [table2(:,2), table2(:,4), table2(:,6)], '-')
axis([0,1,-2,5])
subplot(2,1,2)
plot(table1(:,1), [table1(:,3), table1(:,5)], ...
table2(:,2), [table2(:,3), table2(:,5)], '-')
axis([0,1,-0.5,10])
% TITLE
end % PLOTTING
|
jacob.m
| function J = jacob(x, mum, D, Ks, Sf, y)
X = x(1);
S = x(2);
mug = (mum*S)/(Ks+S);
tmp = Ks*mum/(Ks+S)^2;
J = [mug - D, X*tmp; -mug/y, -D-X/y*tmp];
|
