% Copyright (C) 2001, James B. Rawlings and John G. Ekerdt
%
% This program is free software; you can redistribute it and/or
% modify it under the terms of the GNU General Public License as
% published by the Free Software Foundation; either version 2, or (at
% your option) any later version.
%
% This program is distributed in the hope that it will be useful, but
% WITHOUT ANY WARRANTY; without even the implied warranty of
% MERCHANTABILITY or FITNESS FOR A PARTICULAR PURPOSE. See the GNU
% General Public License for more details.
%
% You should have received a copy of the GNU General Public License
% along with this program; see the file COPYING. If not, write to
% the Free Software Foundation, 59 Temple Place - Suite 330, Boston,
% MA 02111-1307, USA.
K = 108;
P = 2.5;
xlogx = @(x) x.*log(x + eps(x)); % Makes sure 0*log(0) == 0.
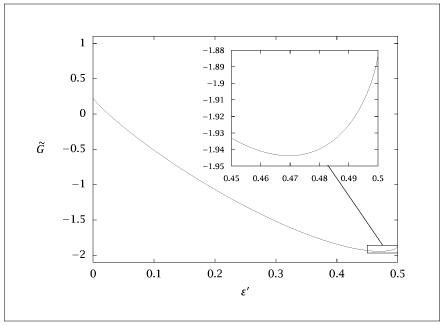
G = @(x) -x*log(K) + (1 - x)*log(P) + xlogx(x) + ...
2*xlogx(0.5 - x) - xlogx(1 - x);
npts = 100;
xcoarse = linspace(0, 0.5, npts)';
Gcoarse = G(xcoarse);
xfine = linspace(0.45, 0.5, npts)';
Gfine = G(xfine);
data = struct();
data.coarse = [xcoarse, Gcoarse];
data.fine = [xfine, Gfine];
Gmin = min(Gfine) - 0.025;
Gmax = max(Gfine) + 0.025;
data.box = [xfine([1; end; end; 1; 1]), [Gmin; Gmin; Gmax; Gmax; Gmin]];
gnuplotsave('pentane.dat', data);
figure()
subplot(1, 2, 1)
plot(xcoarse, Gcoarse, '-b', data.box(:,1), data.box(:,2), '-k')
ylabel('G', 'rotation', 0);
xlabel('\epsilon');
subplot(1, 2, 2)
plot(xfine, Gfine, '-b')
xlabel('\epsilon');
