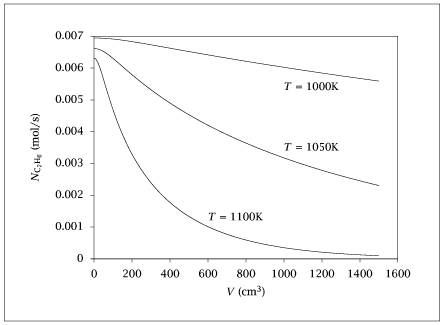
Figure 4.23:
Molar flowrate of ethane versus reactor volume for inlet temperatures of 1000, 1050 and 1100~K.

Code for Figure 4.23
Text of the GNU GPL.
main.m
1
2
3
4
5
6
7
8
9
10
11
12
13
14
15
16
17
18
19
20
21
22
23
24
25
26
27
28
29
30
31
32
33
34
35
36
37
38
39
40
41
42
43
44
45
46
47
48
49
50
51
52
53
54
55
56
57
58
59
60
61
62
63
64
65
66
67
68
69
70 | % Copyright (C) 2001, James B. Rawlings and John G. Ekerdt
%
% This program is free software; you can redistribute it and/or
% modify it under the terms of the GNU General Public License as
% published by the Free Software Foundation; either version 2, or (at
% your option) any later version.
%
% This program is distributed in the hope that it will be useful, but
% WITHOUT ANY WARRANTY; without even the implied warranty of
% MERCHANTABILITY or FITNESS FOR A PARTICULAR PURPOSE. See the GNU
% General Public License for more details.
%
% You should have received a copy of the GNU General Public License
% along with this program; see the file COPYING. If not, write to
% the Free Software Foundation, 59 Temple Place - Suite 330, Boston,
% MA 02111-1307, USA.
%
% This program solves the ethane pyrolysis text example with NO inhibitions.
%
% It was last edited 1/2/2002
% Revised 7/24/2018
% Cleaned up by jbr, 1/15/2022
%E in Joules, mass in grams, T in Kelvin, time in sec, volume in cm3
%Components 1 = C2H6; 2 = NO; 3 = C2H5; 4 = HNO; 5 = H; 6 = C2H4; 7 = H2
A0 = [1e14, 1e12, 3e14, 3.4e12, 1e12, 1e13]';
Ea = [217600, 0, 165300, 28500, 0, 200800]';
R = 8.3144; %(J/gmol-K)
R1 = 82.057; %cc-atm/gmol-K
Tvec = [1000, 1050, 1100]; %K
P = 1.0; % atm
y1f = 0.95;
y2f = 0.05;
Qf = 600.0; %cc/sec
p = struct(); %Create structure to supply parameters to function
p.P = P;
p.R1 = R1;
tags = cellstr (['k1'; 'k_1'; 'k2'; 'k3'; 'k4'; 'k_4']);
v = linspace(0, 1500, 200)';
opts = odeset ('AbsTol', sqrt (eps), 'RelTol', sqrt (eps));
table = zeros(length(v), length(Tvec));
table(:,1) = v;
for j = 1: length(Tvec)
T = Tvec(j);
p.T = T;
N1f = y1f*P/(R1*T)*Qf;
N2f = y2f*P/(R1*T)*Qf;
N0 = [N1f, N2f, 0, 0, 0, 0, 0]';
% compute the rate constants k = A exp(-E/(RT)
for i = 1:length(tags)
p.(tags{i}) = A0(i)*exp(-Ea(i)/(R*T));
end%for
[tsolver, N] = ode15s(@(v,x) rxrate(v,x,p), v, N0, opts);
table(:,j+1) = N(:,1); % store ethane for plotting
end%for
save -ascii ethane_NO_2.dat table;
if (~ strcmp (getenv ('OMIT_PLOTS'), 'true')) % PLOTTING
plot (v, table(:,2:end));
axis([0 1600 0 .007])
% TITLE
end%if % PLOTTING
|
rxrate.m
1
2
3
4
5
6
7
8
9
10
11
12
13 | function dNdv = rxrate(v, N, p)
C = N/sum(N)*p.P/(p.R1*p.T);
r1 = p.k1*C(1)*C(2) - p.k_1*C(3)*C(4);
r2 = p.k2*C(3);
r3 = p.k3*C(1)*C(5);
r4 = p.k4*C(2)*C(5) - p.k_4*C(4);
dNdv = [-r1 - r3; ...
-r1 - r4; ...
r1 - r2 + r3; ...
r1 + r4; ...
r2 - r3 - r4; ...
r2; ...
r3];
|
