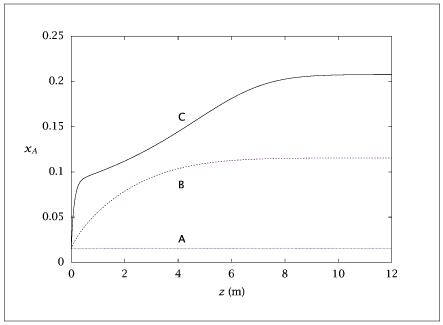
Figure 6.40:
Ammonia mole fraction versus reactor length.

Code for Figure 6.40
Text of the GNU GPL.
main.m
1
2
3
4
5
6
7
8
9
10
11
12
13
14
15
16
17
18
19
20
21
22
23
24
25
26
27
28
29
30
31
32
33
34
35
36
37
38
39
40
41
42
43
44
45
46
47
48
49
50
51
52
53
54
55
56
57
58
59
60
61
62
63
64
65
66
67
68
69
70
71
72
73
74
75
76
77
78
79
80
81
82
83
84
85
86
87
88
89
90
91
92
93
94
95
96
97
98
99
100
101
102
103
104
105
106
107
108 | % Copyright (C) 2001, James B. Rawlings and John G. Ekerdt
%
% This program is free software; you can redistribute it and/or
% modify it under the terms of the GNU General Public License as
% published by the Free Software Foundation; either version 2, or (at
% your option) any later version.
%
% This program is distributed in the hope that it will be useful, but
% WITHOUT ANY WARRANTY; without even the implied warranty of
% MERCHANTABILITY or FITNESS FOR A PARTICULAR PURPOSE. See the GNU
% General Public License for more details.
%
% You should have received a copy of the GNU General Public License
% along with this program; see the file COPYING. If not, write to
% the Free Software Foundation, 59 Temple Place - Suite 330, Boston,
% MA 02111-1307, USA.
% This program simulates the tubular reactor model for ammonia
% synthesis
%
% Revised 8/14/2018
p.P = 300; % atm - pressure of the reactor
p.R = 82.05e-6; %(m^3 atm)/(mol K) - Gas constant
% v0 = 0.16; % m/sec
% Repairing bug.
% Change velocity to get profile C in Figures 6.40, 6.41
% jbr, 3/5/07
p.v0 = 0.05713; % m/sec
p.A = 1; % m^2 - Cross sectional area available for reaction
%p.UA = 1/3; % 1/m
p.UA = 1/2; % 1/m
p.delG0 = -4250; % cal/mol ammonia
p.delH0 = -12000; % cal/mol ammonia
p.Tstd = 298; % K
p.Rg = 1.987; % cal/mol K
p.K0 = exp(-p.delG0/(p.Rg*p.Tstd)); % equilibrium constant at Tstd=298
%p.deltaH = 495; % K/mol
p.deltaH = -2.342; % s K/mol
p.tau = 1500; % K
p.Ta0 = 323; % K - entering coolant (feed) temperature of the reacting gas
p.len = linspace(0,12,250)'; % m - length of reactor
%
% UA corresponds to Ua/C where U is the heat transfer coefficient, A is
% the total heat exchanging surface per unit length of the converter
% and C is the feed rate expressed as heat capacity per unit time.
%
% deltaH is the temperature rise of the reacting gas corresponding to
% the adiabatic formation of 1 mole of Ammonia.
%
% The following set of constants correspond to the rate constants(k1m
% and k2m) and activations energies/gas constants(E1m,E2m) of the
% forward and reverse reactions. Tm is the
% mean temperature which has been used to reparameterise.
%
% = 2.4e12/2*(3/4)^(1.5); % reverse rate constant
p.k0 = 7.794e11; % reverse rate constant
p.E = 20000; % K reverse rate activation energy
%
% Initial flows
%
initial.Q0 = p.v0*p.A; % m^3/s
initial.Nt0 = initial.Q0*p.P/(p.R*p.Ta0);
initial.xn0 = 0.985*0.25; % N_2 feed mole fraction
initial.xh0 = 0.985*0.75; % H_2 feed mole fraction
initial.xnh0 = 0.015; % Ammonia feed mole fraction
initial.Nnh0 = initial.xnh0*initial.Nt0;
initial.Nh0 = initial.xh0*initial.Nt0;
initial.Nn0 = initial.xn0*initial.Nt0;
%
% Solve for the multiple steady states using either T0guess=360 or 600
% or 800 K
T0guess=[300;600;900];
% T0guess=[600];
table1 = [p.len];
for i=1:length(T0guess)
opts = optimset ('MaxFunEvals', 2000, ...
'MaxIter', 500);
[T0,fval,info] = fsolve(@(T0) feed_condition(T0, p, initial), T0guess(i), opts);
% Solve for the exact profiles for no. of moles of Ammonia, x(:,1), and
% temperatures x(:,2) and x(:,3)
x0=[initial.Nnh0; T0; T0];
opts = odeset('AbsTol', sqrt(eps), 'RelTol', sqrt(eps));
[tsolver, x] = ode15s(@(t, x) ivpjbr(t, x, p, initial), p.len, x0, opts);
NT = initial.Nn0 + initial.Nh0 + 2*initial.Nnh0 - x(:,1);
xnh = x(:,1)./NT;
table1 = [table1 x xnh];
end
save -ascii ammonia_profile.dat table1;
if (~ strcmp (getenv ('OMIT_PLOTS'), 'true')) % PLOTTING
subplot(2,1,1);
plot (table1(:,1),table1(:,[3,4,7,8,11,12]));
% TITLE ammonia_profile
subplot(2,1,2);
plot (table1(:,1),table1(:,[5,9,13]));
% TITLE ammonia_profile_x
end % PLOTTING
|
ivpjbr.m
1
2
3
4
5
6
7
8
9
10
11
12
13
14
15
16
17
18
19 | function xdot = ivpjbr(t, x, p, initial)
Nnh = x(1);
T = x(2);
Ta = x(3);
RT = p.R*T;
Nn = initial.Nn0 - 1/2*(Nnh - initial.Nnh0);
Nh = initial.Nh0 - 3/2*(Nnh - initial.Nnh0);
Nt = Nn + Nh + Nnh;
pn = (Nn/Nt)*p.P;
ph = (Nh/Nt)*p.P;
pnh = (Nnh/Nt)*p.P;
qadd = (Ta - T)*p.UA;
k = p.k0*exp(-p.E/T);
K = p.K0*exp(-p.delH0/p.Rg*(1/T - 1/p.Tstd));
rxrate = k/RT* ( K^2 * pn*ph^(1.5)/pnh - pnh/ph^(1.5) );
xdot = zeros(3, 1);
xdot(1) = p.A * 2*rxrate;
xdot(2) = qadd - rxrate*p.deltaH;
xdot(3) = qadd;
|
feed_condition.m
| function error = feed_condition(T0, p, initial)
x0 = [initial.Nnh0; T0; T0];
opts = odeset('AbsTol', sqrt(eps), 'RelTol', sqrt(eps));
[tsolver, x] = ode15s(@(t, x) ivpjbr(t, x, p, initial), p.len, x0, opts);
Taend = x((length(x)),3);
error = p.Ta0 - Taend;
|
