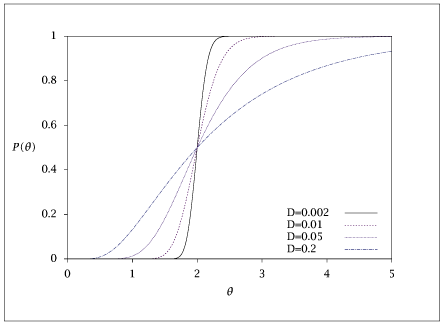
Figure 8.10:

P(\theta ) versus \theta for plug flow with dispersion number D, \tau =2.

Code for Figure 8.10

Text of the GNU GPL.

main.m


 1
 2
 3
 4
 5
 6
 7
 8
 9
10
11
12
13
14
15
16
17
18
19
20
21
22
23
24
25
26
27
28
29
30
31
32
33
34
35
36
37
38
39
% Copyright (C) 2001, James B. Rawlings and John G. Ekerdt
%
% This program is free software; you can redistribute it and/or
% modify it under the terms of the GNU General Public License as
% published by the Free Software Foundation; either version 2, or (at
% your option) any later version.
%
% This program is distributed in the hope that it will be useful, but
% WITHOUT ANY WARRANTY; without even the implied warranty of
% MERCHANTABILITY or FITNESS FOR A PARTICULAR PURPOSE.  See the GNU
% General Public License for more details.
%
% You should have received a copy of the GNU General Public License
% along with this program; see the file COPYING.  If not, write to
% the Free Software Foundation, 59 Temple Place - Suite 330, Boston,
% MA 02111-1307, USA.

x = linspace(0,5,200)';
tau = 2;
Ds = [0.002 0.01 0.05 0.2];
%Ds = [.005];

for i = 1:length(Ds)
    D = Ds(i);
    arg = (1 - x/tau)./sqrt(x/tau)/sqrt(4*D);
    P(:,i) = 0.5*(1-erf(arg));
    %  LevP(:,i) = 0.5*(1+erf( ((x/tau) - 1)./sqrt(4*D) ));
    p(:,i) = 1/(2*tau*sqrt(pi*4*D)) .* exp(-arg.*arg).*(tau./x + 1)./sqrt(x/tau);
end

Ptable = [x P];
ptable = [x p];

save -ascii dispersionP.dat Ptable;

if (~ strcmp (getenv ('OMIT_PLOTS'), 'true')) % PLOTTING
    plot (Ptable(:,1), Ptable(:,2:5));
    % TITLE
end % PLOTTING