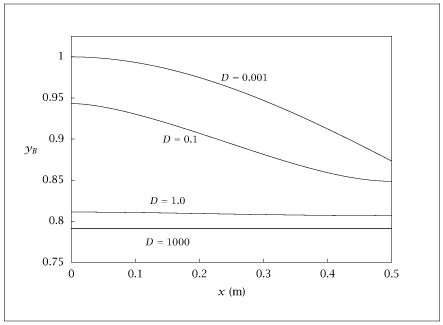
Figure 8.37:
Yield of desired product B versus reactor length for different dispersion numbers.
Code for Figure 8.37
Text of the GNU GPL.
main.py
1
2
3
4
5
6
7
8
9
10
11
12
13
14
15
16
17
18
19
20
21
22
23
24
25
26
27
28
29
30
31
32
33
34
35
36
37
38
39
40
41
42
43
44
45
46
47
48
49
50
51
52 | # Converted from dispersedpfr.m - dispersed PFR with 2 reactions, varying D
import numpy as np
from scipy.optimize import fsolve
from misc import colloc, octave_save
k1 = 1.
k2 = 1.
v = 1.
caf = 1.
cbf = 0.
length = 0.5
ncolpt = 50
z_col, A_col, B_col, Q_col = colloc(ncolpt-2, 'left', 'right')
z_col = z_col * length
A_col = A_col / length
B_col = B_col / (length**2)
def pfrcol(x, D):
ca = x[:ncolpt]
cb = x[ncolpt:2*ncolpt]
Rab = np.concatenate([-k1*ca, k1*ca - 2.*k2*cb**2])
first = np.concatenate([A_col @ ca, A_col @ cb])
second = np.concatenate([B_col @ ca, B_col @ cb])
res = -v*first + D*second + Rab
# BCs
first_ca = A_col @ ca
first_cb = A_col @ cb
res[0] = v*ca[0] - D*first_ca[0] - v*caf
res[ncolpt-1] = first_ca[-1]
res[ncolpt] = v*cb[0] - D*first_cb[0] - v*cbf
res[2*ncolpt-1] = first_cb[-1]
return res
Dvec = [1000., 1., 0.1, 1e-3]
nD = len(Dvec)
tables = []
for i, D in enumerate(Dvec):
x0 = np.concatenate([caf*np.ones(ncolpt), caf*np.ones(ncolpt)])
x, _, info, _ = fsolve(lambda x: pfrcol(x, D), x0,
full_output=True, xtol=1e-10)[:4]
if info != 1:
print(f'warning: fsolve failed for D={D}, info={info}')
ca = x[:ncolpt]
cb = x[ncolpt:2*ncolpt]
conv = (caf - ca) / caf
yield_ = np.where(conv > 0, cb / (caf - ca), 0.)
tables.append(np.column_stack([z_col, conv, yield_]))
octave_save('dispersedpfr.dat',
*[('table%d' % i, tables[i]) for i in range(nD)])
|