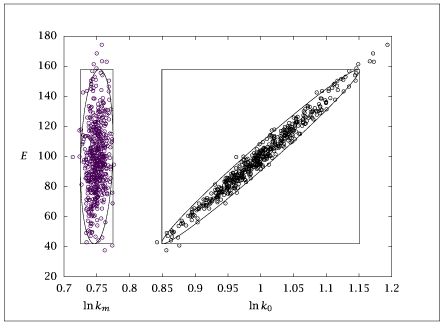
Figure 9.11:
Reducing parameter correlation by centering the data.
Code for Figure 9.11
Text of the GNU GPL.
main.py
1
2
3
4
5
6
7
8
9
10
11
12
13
14
15
16
17
18
19
20
21
22
23
24
25
26
27
28
29
30
31
32
33
34
35
36
37
38
39
40
41
42
43
44
45
46 | # Converted from arrhenius_center.m - Arrhenius centered parameterization
import numpy as np
from misc import ellipse, octave_save
chisq = 5.99
lnk0 = 1.; E = 100.
ndata = 10; Tmin = 300.; Tmax = 500.
Tmeas = np.linspace(Tmin, Tmax, ndata)
X = np.column_stack([np.ones(ndata), -1./Tmeas])
lnk = X @ np.array([lnk0, E])
measvar = 1e-3
np.random.seed(0)
nexpts = 500
lnkmeas = lnk[:,None] + np.sqrt(measvar)*np.random.randn(ndata, nexpts)
theta = np.linalg.lstsq(X, lnkmeas, rcond=None)[0].T
Tcenter = -1./Tmeas + 1./np.mean(Tmeas)
Xcenter = np.column_stack([np.ones(ndata), Tcenter])
thetacenter = np.linalg.lstsq(Xcenter, lnkmeas, rcond=None)[0].T
npts = 181
amat = X.T @ X / measvar
x, y, major, minor, bbox = ellipse(amat, chisq, npts)
x += lnk0; y += E
minor[:,0] += lnk0; minor[:,1] += E
major[:,0] += lnk0; major[:,1] += E
bbox[:,0] += lnk0; bbox[:,1] += E
bbox1 = bbox.copy()
outline1 = np.column_stack([x, y])
amat2 = Xcenter.T @ Xcenter / measvar
x2, y2, _, _, bbox2 = ellipse(amat2, chisq, npts)
lnkmean = lnk0 - E/np.mean(Tmeas)
x2 += lnkmean; y2 += E
bbox2[:,0] += lnkmean; bbox2[:,1] += E
outline2 = np.column_stack([x2, y2])
octave_save('arrhenius_center.dat',
('theta', theta),
('thetacenter', thetacenter),
('bbox1', bbox1),
('outline1', outline1),
('bbox2', bbox2),
('outline2', outline2))
|