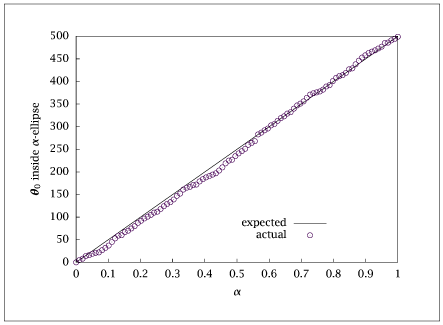
1
2
3
4
5
6
7
8
9
10
11
12
13
14
15
16
17
18
19
20
21
22
23
24
25
26
27
28
29
30
31
32
33
34
35
36
37
38
39
40
41
42
43
44
45
46
47
48
49
50
51
52
53
54
55
56
57
58
59
60
61
62
63
64
65
66
67
68
69
70
71
72
73
74
75
76
77
78
79
80
81
82
83
84
85
86
87
88
89
90
91
92
93
94
95
96
97
98
99
100
101
102
103
104
105
106
107
108
109
110
111 | %
% jbr, 4/8/18
%
model = struct;
model.transcription = 'shooting';
%model.nlp_solver_options.ipopt.linear_solver = 'ma27';
model.x = {'ca'};
model.p = {'k', 'n'};
model.d = {'m_ca'};
model.ode = @(t,x,p) {-p.k*x.ca^p.n};
model.lsq = @(t,x,p) {x.ca-x.m_ca};
tfinal = 5;
nts = 100;
tout = linspace(0,tfinal,nts);
model.tout = tout;
pe = paresto(model);
kac = 0.5;
ca0ac = 2;
nac = 2.5;
thetaac = [kac; nac; ca0ac];
x_ac = ca0ac;
p_ac = [kac; nac];
y_ac = pe.simulate(0, x_ac, p_ac);
% add measurement noise
measvar = 1e-2;
measstddev = sqrt(measvar);
randn('seed',0);
noise = measstddev*randn(1,nts);
y_noisy = y_ac + noise;
% Initial guess, upper and lower bounds for the estimated parameters
small = 1e-3;
large = 5;
np = 3;
theta0 = struct();
theta0.k = kac;
theta0.n = nac;
theta0.ca = ca0ac;
ubtheta = struct();
ubtheta.k = large;
ubtheta.n = large;
ubtheta.ca = large;
lbtheta = struct();
lbtheta.k = small;
lbtheta.n = small;
lbtheta.ca = small;
% loop here to create nmonte data sets and estimate parameters for each
%page_output_immediately(1);
%more off
nmonte = 10; % change to 500 for figure in text
alph(1:nmonte) = NaN;
for i = 1: nmonte
%create noisy data
noise = measstddev*randn(1, nts);
y_noisy = y_ac + noise;
%estimate parameters
[est, y, p] = pe.optimize(y_noisy, theta0, lbtheta, ubtheta);
i
conf = pe.confidence(est, 0.95);
disp('Estimated parameters')
disp(est.thetavec)
% disp(est.theta)
% disp('Bounding box intervals')
% disp(conf.bbox)
% store the estimate, contour distance of estimate from true parameters,
% alpha value of this contour
samplevar = est.f/(nts - np);
thetamont(:,i) = est.thetavec;
diff(:,i) = est.thetavec - thetaac;
cont = diff(:,i)'*conf.H*diff(:,i)/(2*np*samplevar);
alph(i) = fcdf(cont, np, nts-np);
end
% post processing for confidence region plot
amin = 0.0;
amax = 0.99995;
nas = 100;
alphavec=linspace(amin,amax,nas)';
expected = alphavec*nmonte;
actual(1:nas) = NaN;
for i = 1: nas
actual(i) = sum(alph <= alphavec(i));
end
table = [alphavec expected actual(:)];
save nthmonte.dat table;
if (~ strcmp (getenv ('OMIT_PLOTS'), 'true')) % PLOTTING
plot (alphavec, expected, alphavec, actual, '+');
% TITLE
end % PLOTTING
|
