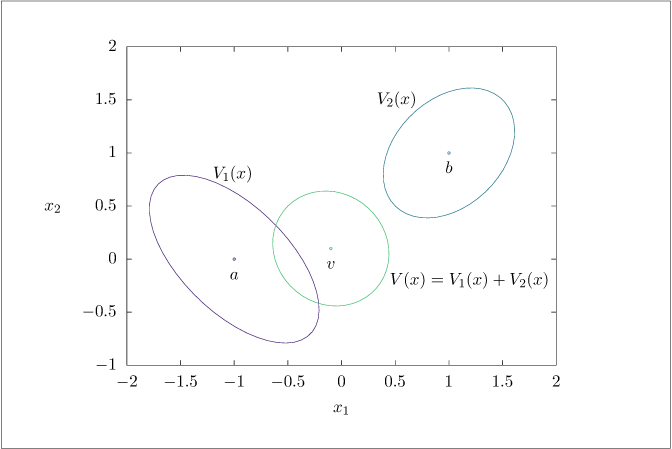
1 2 3 4 5 6 7 8 9 10 11 12 13 14 15 16 17 18 19 20 21 22 23 24 25 26 27 28 29 30 31 32 33 34 35 | % Example sum of two quadratic functions. a = [-1; 0]; b = [1; 1]; A = [1.25000, 0.75000; 0.75000 1.25000]; B = [1.50000, -0.50000; -0.50000, 1.50000]; % add the two quadratics H = A + B; h = H\(A*a + B*b); d = -(A*a + B*b)'*h + a'*A*a + b'*B*b; % plot resulting ellipse for combining two ellipses % V(x) = V_1(x) + V_2(x) level = 0.5; npts = 50; [xA, yA] = ellipse(A, level, npts, a); [xB, yB] = ellipse(B, level, npts, b); level = (2 - d/2)*2; [xH, yH] = ellipse(H, level, npts, h); % Make plot. plot(xA, yA, '-r', a(1), a(2), 'or', ... xB, yB, '-g', b(1), b(2), 'og', ... xH, yH, '-b', h(1), h(2), 'ob'); legend('A', 'a', 'B', 'b', 'H = A + B', 'h', 'Location', 'NorthWest'); % Save data. data = struct(); data.contours = [xA, yA, xB, yB, xH, yH]; data.centers = [a', b', h']; gnuplotsave('nestedV.dat', data); |
1 2 3 4 5 6 7 8 9 10 11 12 13 14 15 16 17 18 19 20 21 22 23 24 25 26 27 28 29 30 31 32 33 34 35 36 37 38 39 40 41 42 43 44 45 46 47 48 49 50 51 52 53 54 55 56 57 58 59 60 61 62 63 64 65 66 67 68 69 70 71 72 73 74 75 76 77 78 79 80 81 82 83 84 85 86 87 88 89 90 91 92 93 94 95 96 97 98 99 100 101 102 103 104 105 | % Copyright (C) 2001, James B. Rawlings and John W. Eaton % % This program is free software; you can redistribute it and/or % modify it under the terms of the GNU General Public License as % published by the Free Software Foundation; either version 2, or (at % your option) any later version. % % This program is distributed in the hope that it will be useful, but % WITHOUT ANY WARRANTY; without even the implied warranty of % MERCHANTABILITY or FITNESS FOR A PARTICULAR PURPOSE. See the GNU % General Public License for more details. % % You should have received a copy of the GNU General Public License % along with this program; see the file COPYING. If not, write to % the Free Software Foundation, 59 Temple Place - Suite 330, Boston, % MA 02111-1307, USA. % [x, y, major, minor, bbox] = ellipse (amat, level, n, shift) % % Given a 2x2 matrix, generate ellipse data for plotting. The % arguments N and SHIFT are optional. If N is an empty matrix, a % default value of 100 is used. function [x, y, major, minor, bbox] = ellipse (amat, level, n, shift) if (nargin < 3) n = 100; end if (isempty (n)) n = 100; end if (nargin < 4) shift = [0, 0]; end ss = size (shift); if (any (ss ~= [1, 2])) if (ss == [2, 1]) shift = shift'; else error ('shift must be a 2-element row vector'); end end if (nargin > 1) [v, l] = eig (amat / level); dl = diag(l); if (any (imag (dl)) || any (dl <= 0)) error ('ellipse: amat must be positive definite'); end % Generate contour data. a = 1 / sqrt (l(1,1)); b = 1 / sqrt (l(2,2)); t = linspace (0, 2*pi, n)'; xt = a * cos (t); yt = b * sin (t); % Rotate the contours. ra = atan2 (v(2,1), v(1,1)); cos_ra = cos (ra); sin_ra = sin (ra); x = xt * cos_ra - yt * sin_ra + shift(1); y = xt * sin_ra + yt * cos_ra + shift(2); % Endpoints of the major and minor axes. minor = (v * diag ([a, b]))'; major = minor; major(2,:) = -major(1,:); minor(1,:) = -minor(2,:); t = [1; 1] * shift; major = major + t; minor = minor + t; % Bounding box for the ellipse using magic formula. ainv = inv (amat); xbox = sqrt (level * ainv(1,1)); ybox = sqrt (level * ainv(2,2)); bbox = [xbox ybox; xbox -ybox; -xbox -ybox; -xbox ybox; xbox ybox]; t = [1; 1; 1; 1; 1] * shift; bbox = bbox + t; else error ('usage: ellipse (amat, level, n, shift)'); end % end%function |