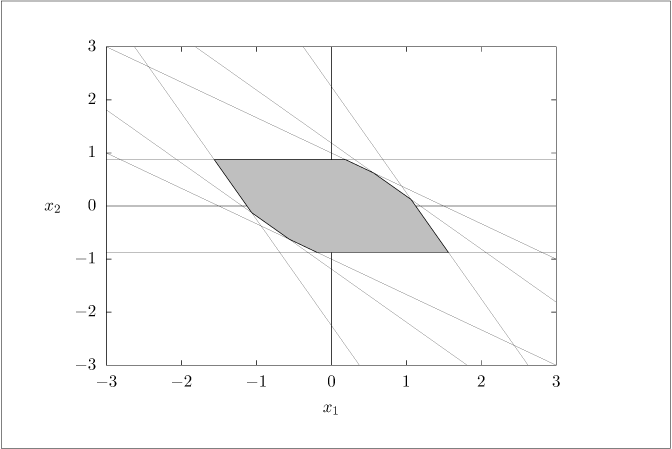
# [makes] Xnterminal_c.dat# Exercise "Terminal constraint and region of attraction" part (c)# Define model, cost function, and bounds.importnumpyasnpfrommiscimportgnuplotsavefromfindXnimportfindXndefvertices2lines(p,xlims,ylims):""" Returns 2-column array of line segments corresponding to edges of the polygon with vertices in columns of p (which must be in proper order). Each line segment has 101 interpolation points (to make gnuplot happy), and there is a row of NaNs inserted between each line. """dp=np.diff(p,axis=1)N=p.shape[1]-1blocks=[]xlims=np.linspace(xlims[0],xlims[1],101).reshape(-1,1)ylims=np.linspace(ylims[0],ylims[1],101).reshape(-1,1)foriinrange(N):slope=dp[1,i]/dp[0,i]ifnp.isinf(slope)ornp.isnan(slope):x=p[0,i]*np.ones((2,1))y=ylimselse:x=xlimsy=slope*(xlims-p[0,i])+p[1,i]blocks.append(np.hstack((x,y)))blocks.append(np.array([[np.nan,np.nan]]))returnnp.vstack(blocks)# Define model, cost function, and boundsA=np.array([[2,1],[0,2]])B=np.array([[1,0],[0,1]])N=3alpha=1e-5Q=alpha*np.eye(2)R=np.eye(2)K=np.zeros(B.T.shape)# Boundsxlb=np.array([-np.inf,-np.inf])xub=np.array([5,np.inf])ulb=np.array([-1,-1])uub=np.array([1,1])# Find region of stabilityXn,V,Z=findXn(A,B,K,N,xlb,xub,ulb,uub,'termeq')p=V[-1]# Vertices of Xnxlims=[-3,3]ylims=[-3,3]Xnlines=vertices2lines(p,xlims,ylims)# Save data filesp=p.T# Vertices of Xnl=Xnlines# Lines for all sides# Save to .dat filegnuplotsave('Xnterminal_c.dat',{'p':p,'l':l})