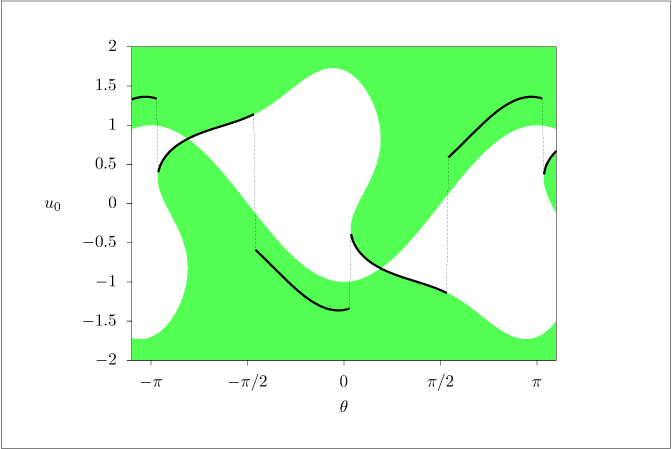
First element of control constraint set \mathcal {U}_3(x) (shaded) and control law \kappa _3(x) (line) versus x=(\cos (\theta ),\sin (\theta )), \theta \in [-\pi ,\pi ] on the unit circle for a nonlinear system with terminal constraint.
# [makes] circle.datimportnumpyasnpimportmatplotlib.pyplotaspltfromscipy.optimizeimportminimizefromscipyimportsignalimportosfrommiscimportgnuplotsave# Finding the feasible region and optimal solution of the (u, u^3) example.thmin=-1.1thmax=1.1# Need to sample with higher density for this boundary.theta=np.linspace(thmin,thmax,1001)# Points on unit circle.x=np.cos(np.pi*theta)y=np.sin(np.pi*theta)# Weird curvy branch for numerator = 0.numcurves=np.full((3,len(theta)),np.nan)foriinrange(len(theta)):r=np.roots([3,-3*x[i],-3*x[i]**2,-x[i]**3+4*y[i]])r[np.abs(np.imag(r))>1e-6]=np.nannumcurves[:,i]=np.real(r)# Nice branch where denominator = 0.dencurve=-x# Need to do some magic to plot the curve properly because it's a multivalued# function. Loop through the points, finding the next closest one at each step.# This works because the curve is not self-intersecting and we know one of the# endpoints. We bring the nice denominator curve along for the ride so that# the region is easier to plot later on.indices=np.where(~np.isnan(numcurves))inum,jnum=indices[0],indices[1]z=np.vstack([numcurves[inum,jnum],dencurve[jnum],theta[jnum]])zscale=np.max(z,axis=1)-np.min(z,axis=1)z=z/zscale[:,np.newaxis]foriinrange(1,z.shape[1]):dist=np.sum((z[:,i:]-z[:,i-1][:,np.newaxis])**2,axis=0)inext=np.argmin(dist)+iifinext!=i:z[:,[i,inext]]=z[:,[inext,i]]# Rescalez=z*zscale[:,np.newaxis]ufeas1=np.maximum(z[0,:],z[1,:])# Top pieceufeas2=np.minimum(z[0,:],z[1,:])# Bottom piecethfeas=z[2,:]# Now find the minimizer. We use a coarser gridding here.theta=np.linspace(thmin,thmax,241)defcost(u,th,firstsign):""" Computes optimal cost with inf if infeasible. """x=np.cos(np.pi*th)y=np.sin(np.pi*th)# Calculate b.bnum=3*u**3-3*x*u**2-3*x**2*u-x**3+4*ybden=12*(u+x)b=bnum/bden# Simulate the system.useq=[u,-x/2-u/2+firstsign*np.sqrt(b),-x/2-u/2-firstsign*np.sqrt(b)]V=0foriinrange(4):V=V+x**2+y**2ifi==3:breakV=V+useq[i]**2x=x+useq[i]y=y+useq[i]**3V=np.array(np.real(V))V[b<0]=np.inf# These points are infeasible.returnV# Vectorized version for meshgriddefcost_vectorized(u_array,th_array,firstsign_array):""" Vectorized version of cost function for meshgrid inputs """result=np.zeros_like(u_array)foriinrange(u_array.shape[0]):forjinrange(u_array.shape[1]):result[i,j]=cost(u_array[i,j],th_array[i,j],firstsign_array[i,j])returnresulturange=np.linspace(-2,2,1001)th,u=np.meshgrid(theta,urange)# Calculate costs with both positive and negative firstsignVplus=np.zeros_like(u)Vminus=np.zeros_like(u)foriinrange(u.shape[0]):forjinrange(u.shape[1]):Vplus[i,j]=cost(u[i,j],th[i,j],1)Vminus[i,j]=cost(u[i,j],th[i,j],-1)# Find minimum between the two optionsV=np.minimum(Vplus,Vminus)firstsign=1-2*(Vplus>Vminus)# -1 if Vminus < Vplus, otherwise +1# Find local minima.Vmid=V[1:-1,:]# Slice out edges.localmin=(Vmid<V[:-2,:])&(Vmid<V[2:,:])# Add edges backlocalmin=np.vstack([np.zeros((1,localmin.shape[1]),dtype=bool),localmin,np.zeros((1,localmin.shape[1]),dtype=bool)])ilocal=np.where(localmin)Vlocal=V[ilocal]thlocal=th[ilocal]ulocal=u[ilocal]# Find the minima in the grid of valuesVmin=np.min(V,axis=0)imin=np.argmin(V,axis=0)umin=urange[imin]# Refine the minimum using scipy's minimizeforiinrange(len(umin)):result=minimize(lambdau_val:cost(u_val,theta[i],firstsign[imin[i],i]),umin[i],method='nelder-mead')umin[i]=result.x[0]Vmin[i]=result['fun']defgetdiscont(x,y,N):""" Finds discontinuities in y and adds in NaNs to make a gap. """dy=np.abs(np.diff(y))idiscont=np.where(dy>np.mean(dy)+N*np.std(dy))[0]expand=lambdaz:np.vstack(([z],np.append(z[:-1]+0.5*np.diff(z),np.nan)))x=expand(x)xdc1=x[0,idiscont]xdc2=x[0,idiscont+1]x[1,idiscont]=np.nany=expand(y)ydc1=y[0,idiscont]ydc2=y[0,idiscont+1]y[1,idiscont]=np.nan# Assemble discontinuities for plotting.xdc=np.vstack(([xdc1],[xdc2],[np.nan*np.ones_like(xdc2)]))ydc=np.vstack(([ydc1],[ydc2],[np.nan*np.ones_like(ydc2)]))# Package everybody up. Recall lame numpy needs Fortran column orderingpieces=np.column_stack([x.flatten(order='F'),y.flatten(order='F')])jumps=np.column_stack([xdc.flatten(order='F'),ydc.flatten(order='F')])returnpieces,jumps# Get discontinuitiesupieces,ujumps=getdiscont(theta,umin,2)Vpieces,Vjumps=getdiscont(theta,Vmin,2)ifnotos.getenv('OMIT_PLOTS')=='true':# Make a plot of u.plt.figure()# Create the fill for infeasible regionufill=np.concatenate([ufeas1,ufeas2[::-1]])thfill=np.concatenate([thfeas,thfeas[::-1]])plt.fill(thfill,ufill,'r',edgecolor='r')# Plot the restplt.plot(thlocal,ulocal,'bs')# Local optimaplt.plot(upieces[:,0],upieces[:,1],'g-')# Global optimaplt.plot(ujumps[:,0],ujumps[:,1],'g:')# Jumps in global optimaplt.legend(['Infeasible','Local Optima','Global Optima'])plt.xlabel(r'$\theta/\pi$')plt.ylabel('Input')# Make a plot of V.plt.figure()plt.semilogy(thlocal,Vlocal,'sr')# Local optimaplt.semilogy(Vpieces[:,0],Vpieces[:,1],'g-')# Global optimaplt.semilogy(Vjumps[:,0],Vjumps[:,1],'g:')# Jumps in global optimaplt.xlabel(r'$\theta/\pi$')plt.ylabel('Cost')plt.show(block=False)# Now save data.feas=np.column_stack([thfeas,ufeas1,ufeas2])data={'upieces':upieces,'ujumps':ujumps,'Vpieces':Vpieces,'Vjumps':Vjumps,'feas':feas}gnuplotsave('circle.dat',data)