# points = stackcontours(c)## Takes the output of contourc and stacks it into a single data table with NaNs# inserted for line breaks. This allows the contours to be plotted using the# standard plot() function.importnumpyasnpdefstackcontours(c):""" points = stackcontours(c) Takes the output of contourc and stacks it into a single data table with NaNs inserted for line breaks. This allows the contours to be plotted using the standard plot() function. """ifnotisinstance(c,np.ndarray):raiseTypeError("Input must be numpy array")# First have to figure out how many chunks there are, then save each chunk# to a cell array, and finally concatenate.nchunks=0offset=0# Convert to 0-based indexingwhileoffset<c.shape[1]:nchunks+=1offset=offset+int(c[1,offset])+1chunks=[None]*nchunksoffset=0foriinrange(len(chunks)):chunk_size=int(c[1,offset])chunk=c[:,(offset+1):(offset+chunk_size+1)]chunks[i]=np.hstack((chunk,np.full((2,1),np.nan)))offset=offset+1+chunk_sizepoints=np.hstack(chunks).Treturnpoints
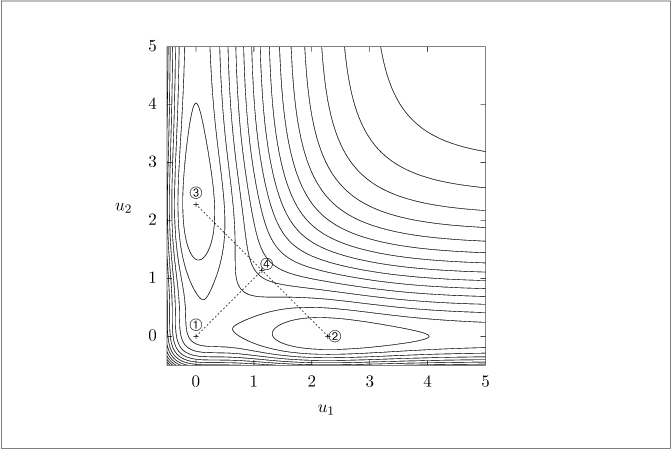
# Example of nonconvex optmization in which the convex combination of# one-variable-at-a-time optimizations is not decreasing.# [depends] functions/stackcontours.pyimportsysimportosimportmatplotlib.pyplotaspltimportnumpyasnpfromscipyimportoptimizesys.path.append('functions/')fromstackcontoursimportstackcontoursfrommiscimportgnuplotsavedefV(x,y):a=1.1b=0.4return(np.exp(-2*x)-2*np.exp(-x)+np.exp(-2*y)-2*np.exp(-y)+a*np.exp(-b*((x+0.2)**2+(y+0.2)**2)))# Grid setupnxy=221xvec=np.linspace(-0.5,5,nxy)yvec=np.linspace(-0.5,5,nxy)ncont=15xgrid,ygrid=np.meshgrid(xvec,yvec)Vgrid=V(xgrid,ygrid)# Initial pointsx0=0y0=0xguess=2.5yguess=2.5# One variable at a time minimizationxp=optimize.fmin(lambdax:V(x,y0),xguess,disp=False)[0]yp=optimize.fmin(lambday:V(x0,y),yguess,disp=False)[0]# Midpointxw=(x0+xp)/2yw=(y0+yp)/2# Plottingifnotos.getenv('OMIT_PLOTS')=='true':plt.figure()cs=plt.contour(xvec,yvec,Vgrid,ncont)ifnotos.getenv('OMIT_PLOTS')=='true':plt.plot(x0,y0,'ok',xp,y0,'+k',x0,yp,'+k',xw,yw,'ok',[xp,x0],[y0,yp],'-k',[x0,xw],[y0,yw],'-k')# Build MATLAB-format contour matrix from matplotlib output, then stackcontoursc_cols=[]forlevel,segsinzip(cs.levels,cs.allsegs):forseginsegs:npts=seg.shape[0]header=np.array([[level],[npts]])c_cols.append(np.hstack([header,seg.T]))c=np.hstack(c_cols)# Save datadata={}data['points']=np.array([[x0,y0],[xp,y0],[x0,yp],[xw,yw]])data['lines']=np.array([[x0,y0],[xw,yw],[np.nan,np.nan],[xp,y0],[x0,yp]])data['contours']=stackcontours(c)gnuplotsave('nonconvex.dat',data)