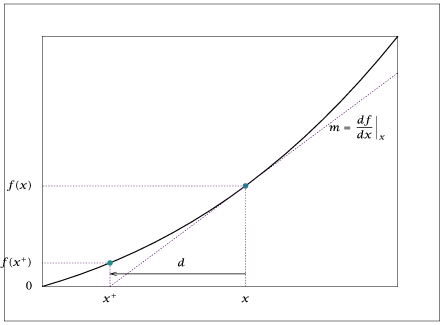
import numpy as np
import matplotlib.pyplot as plt
npts = 20
xlow = 2
xhigh = 3.75
x = np.linspace(xlow, xhigh, npts)
def f(x):
return x**3 - 2*x**2 + 3*x - 6
def df(x):
return 3*x**2 - 4*x + 3
fx = f(x)
x0 = 3
fx0 = f(x0)
dfx0 = df(x0)
x1 = x0 - fx0/dfx0
fx1 = f(x1)
gap = 0.75
xzero = np.array([xlow, xhigh])
xzero.shape = (2,1)
yzero = np.array([0, 0])
yzero.shape = (2,1)
xt0 = np.array([x1, x0 + gap])
xt0.shape = (2,1)
yt0 = fx0 + dfx0 * (xt0 - x0)
yt0.shape = (2,1)
axispts = np.array([[x0, 0, x1, 0],
[x0, fx0, x1, fx1],
[xlow, fx0, xlow, fx1]])
tangents = np.column_stack ((xzero, yzero, xt0, yt0))
plt.figure()
plt.plot(x, fx, 'b')
plt.plot(axispts[:,0], axispts[:,1])
plt.plot(axispts[:,2], axispts[:,3])
plt.plot(xzero, yzero, 'g')
plt.plot(xt0, yt0, 'y')
plt.show(block=False)
# Correct data export section
with open("newton.dat", "w") as f:
np.savetxt(f, np.column_stack((x, fx)), fmt='%f', header="Table x and f(x)")
f.write("\n\n")
np.savetxt(f, axispts, fmt='%f', header="Axes Points")
f.write("\n\n")
np.savetxt(f, tangents, fmt='%f', header="Tangents")
f.write("\n\n")
np.savetxt(f, np.array([x0, fx0, x1, fx1]).reshape(1, -1), fmt='%f', header="Curve Points")
