Figure 1.6:
Contours of constant f(x)=x^TAx.
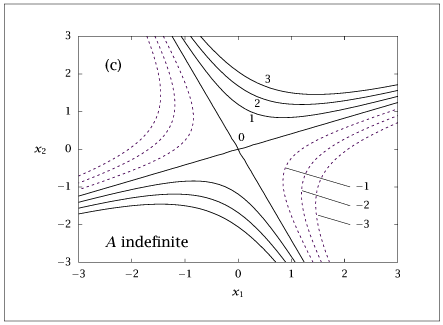
Code for Figure 1.6
Text of the GNU GPL.
main.py
1
2
3
4
5
6
7
8
9
10
11
12
13
14
15
16
17
18
19
20
21
22 | import numpy as np
import matplotlib.pyplot as plt
A = np.array([[-1, 0], [0, 1]])
theta = np.pi / 8
rot = np.array([[np.cos(theta), -np.sin(theta)], [np.sin(theta), np.cos(theta)]])
A = rot.T @ A @ rot
npts = 51
v = np.array([-3, -2, -1, 0, 1, 2, 3])
x = np.linspace(-3, 3, npts)
y = x
X, Y = np.meshgrid(x, y)
xy = np.vstack((X.flatten(), Y.flatten()))
z = np.diag(xy.T @ A @ xy).reshape(npts, npts)
c = plt.contour(x, y, z, levels=v)
plt.show(block=False)
with open("quadhyp.dat", "w") as f:
for j in range(len(v)):
for i, seg in enumerate(c.allsegs[j]):
np.savetxt(f, seg, fmt='%f')
f.write('\n\n')
|