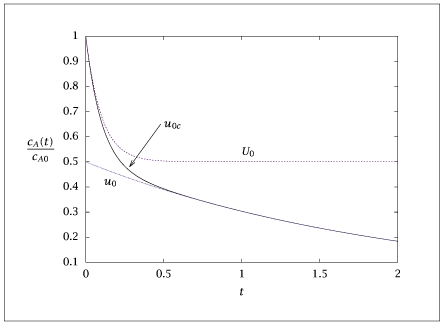
Figure 2.12:
Leading-order inner U_0, outer u_0, and composite solutions u_{0c}, for Example \ref {ex:rxequil} with \epsilon =0.2, K=1, and k_{2}=1.
Code for Figure 2.12
Text of the GNU GPL.
main.py
1
2
3
4
5
6
7
8
9
10
11
12
13
14
15
16
17
18
19
20
21
22
23
24
25
26
27
28 | import numpy as np
import matplotlib.pyplot as plt
plt.figure()
K = 1
eps = 2e-1
t = np.arange(0, 2.01, 0.01)
Uinn = np.exp(-(1+K)*t/eps) + 1/(1+K)*(1 - np.exp(-(1+K)*t/eps))
plt.plot(t, Uinn, '--')
Vinn = 1 - Uinn
Uout = 1/(1+K) * np.exp(-K/(1+K)* t)
plt.plot(t, Uout, ':')
Ucomp = Uinn + Uout - Uout[0]
plt.plot(t, Ucomp)
plt.xlabel('t')
plt.ylabel('u(t)')
plt.axis([0, 2, 0, 1])
plt.legend(['Inner solution', 'Outer solution', 'Composite solution'])
plt.show(block=False)
data = np.column_stack( (t, Ucomp, Uinn, Uout) )
with open("rxnequil.dat", "w") as f:
np.savetxt(f, data, fmt='%f', header="data")
|