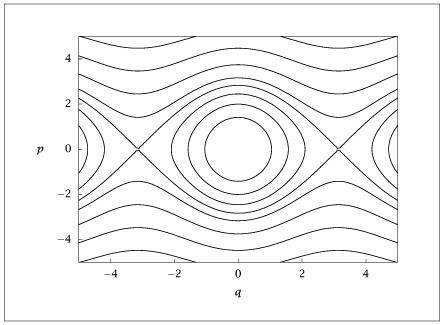
Figure 2.16:
Energy landscape for a pendulum; H = \frac {1}{2} p^2 -\kappa \cos q; \kappa =2.
Code for Figure 2.16
Text of the GNU GPL.
main.py
1
2
3
4
5
6
7
8
9
10
11
12
13
14
15
16
17
18
19
20
21
22
23
24
25 | import numpy as np
import matplotlib.pyplot as plt
n = 101
x = np.linspace(-5, 5, n)
y = np.linspace(-5, 5, n)
kappa = 2
xx, yy = np.meshgrid(x, y)
z = 0.5 * yy**2 - kappa * np.cos(xx)
val = [-1, 0, 1, 2, 3, 5, 8, 12]
contour_set = plt.contour(x, y, z, val)
plt.axis([-5, 5, -5, 5])
plt.xlabel("$q$")
plt.text(-5.75, 0, "$p$")
with open('heteroclinic.dat', 'w') as myfile:
for level_segs in contour_set.allsegs:
for vertices in level_segs:
np.savetxt(myfile, vertices, fmt='%f')
myfile.write('\n\n')
plt.show(block=False)
|