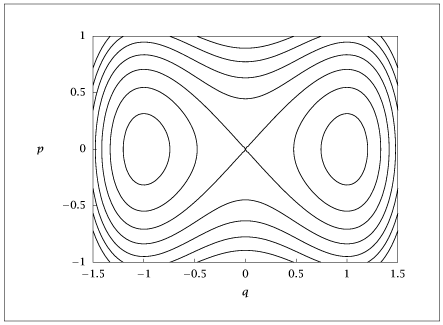
import numpy as np
import matplotlib.pyplot as plt
n = 101
x = np.linspace(-1.5, 1.5, n)
y = np.linspace(-1.0, 1.0, n)
xx, yy = np.meshgrid(x, y)
xx2 = np.power(xx, 2)
xx4 = np.power(xx2, 2)
yy2 = np.power(yy, 2)
z = 0.5 * yy2 + 0.25 * xx4 - 0.5 * xx2
val = [-0.2, -0.1, 0, 0.1, 0.2, 0.3, 0.4]
contour_fig, ax = plt.subplots()
c = ax.contour(x, y, z.T, levels=val)
ax.axis([-1.5, 1.5, -1, 1])
ax.set_xlabel("$q$")
ax.text(-1.7, 0, "$p$")
plt.savefig("homoclinic.eps", format='eps')
plt.show(block=False)
with open('homoclinic.dat', 'w') as myfile:
for i, collection in enumerate(c.collections):
paths = collection.get_paths()
for path in paths:
np.savetxt(myfile, path.vertices, fmt='%f')
myfile.write('\n\n')
