import numpy as np
from scipy.linalg import expm
import matplotlib.pyplot as plt
def setarrow(s, nrow, skip, x):
narrows = x.shape[1] // 2
for i in range(narrows):
cols = slice(2*i, 2*i+2)
arrowloc = np.vstack((x[nrow, cols], x[nrow+skip, cols]))
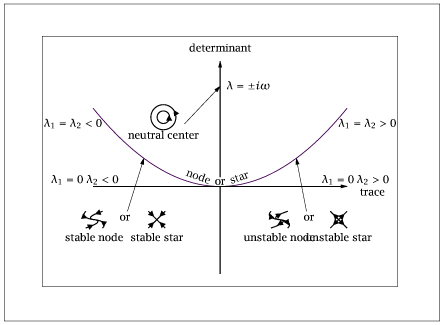
# Generate data for the boundary of the planar dynamics
x = np.linspace(-5, 5, 101)
y = x**2 / 4
quad = np.column_stack((x, y))
lines = np.array([[-5, 0, 0, -7, 0, 0.75],
[5, 0, 0, 0, 0, 10]])
# Neutral center
theta = np.linspace(0, 2*np.pi, 101)
xcenter = np.column_stack((np.cos(theta), np.sin(theta), 0.5*np.cos(theta), 0.5*np.sin(theta)))
# Stable node
x0_list = np.array([[1, 1], [-1, 1], [-1, -1], [1, -1]])
nts = 101
time = np.linspace(0, 15, nts)
A = np.array([[-1, -2], [0, -1]])
xnode = []
for x0 in x0_list:
x = np.zeros((2, nts))
for i, t in enumerate(time):
x[:, i] = expm(A * t) @ x0
xnode.append(x.T)
xnode = np.hstack(xnode)
# Stable star
xstar = np.zeros([2,8])
xstar[0,:] = [1, 1, -1, 1, -1, -1, 1, -1]
# Save data to .dat file with format '%f'
with open("phasebound.dat", "w") as f:
np.savetxt(f, quad, fmt='%f', header="quad")
f.write("\n\n")
np.savetxt(f, lines, fmt='%f', header="lines")
f.write("\n\n")
np.savetxt(f, xcenter, fmt='%f', header="xcenter")
f.write("\n\n")
np.savetxt(f, xnode, fmt='%f', header="xnode")
f.write("\n\n")
np.savetxt(f, xstar, fmt='%f', header="xstar")
# Plot for interactive mode
plt.show(block=False)
