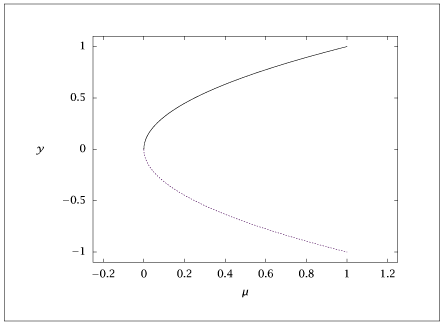
Figure 2.22:

Bifurcation diagram for the saddle-node bifurcation.

Code for Figure 2.22

Text of the GNU GPL.

main.m


1
2
3
4
5
6
7
8
9
npts = 51;
y1 = linspace(0, 1, npts);
y2 = -y1;
x = y1.^2;
plot( x, y1, '-', x, y2, '.')
axis([-0.25, 1.25, -1.1, 1.1])

table = [x', y1', y2'];
save "snbm.dat" table