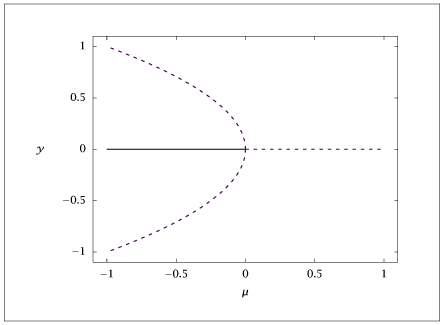
Figure 2.24:
Bifurcation diagrams for the pitchfork bifurcation.
Code for Figure 2.24
Text of the GNU GPL.
main.py
1
2
3
4
5
6
7
8
9
10
11
12
13
14
15 | import numpy as np
import matplotlib.pyplot as plt
npts = 51
x = np.linspace(0, 1, npts).reshape(npts, 1)
y = np.linspace(0, 1, npts).reshape(npts, 1)
xy = y**2
ynull = np.zeros((npts, 1))
table = np.hstack((-x, x, ynull, xy, y, -y, -xy))
with open("pitchforkb.dat", "w") as f:
np.savetxt(f, table, fmt='%f')
plt.plot(table)
plt.show(block=False)
|