import numpy as np
import matplotlib.pyplot as plt
# Forward Euler
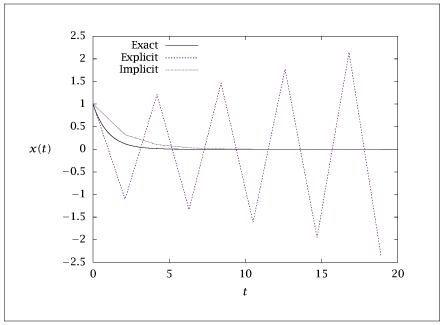
lambd = complex(-1, 0)
# stability limit for (-1,0): dt<2
# stability limit for (-1,5): dt<1/13~0.077
dt = 2.1
G = 1 + lambd * dt
xe = [1]
xi = [1]
t = [0]
tend = 20
Nsteps = round(tend / dt)
# Forward Euler
for i in range(1, Nsteps):
xe.append(G * xe[i - 1])
t.append(t[i - 1] + dt)
# Backward Euler
G = 1 / (1 - lambd * dt)
for i in range(1, Nsteps):
xi.append(G * xi[i - 1])
# Generate exact solution with small time steps
tlist = np.linspace(0, tend, 1001)
xex = np.real(np.exp(lambd * tlist))
# Prepare data for saving
data1 = np.column_stack((t, np.real(xe), np.real(xi)))
data2 = np.column_stack((tlist, xex))
# Save to TimeIntegrationExample.dat file
with open('TimeIntegrationExample.dat', 'w') as f:
np.savetxt(f, data1, fmt='%.8f', header="t xe xi")
f.write("\n\n")
np.savetxt(f, data2, fmt='%.8f', header="tlist xex")
# Optional: Create a plot (commented out to match MATLAB script)
plt.figure()
plt.plot(t, np.real(xe), '-o', label='Forward Euler')
plt.plot(t, np.real(xi), '-x', label='Backward Euler')
plt.plot(tlist, xex, '-', label='Exact')
plt.xlabel('Time (t)')
plt.ylabel('x(t)')
plt.legend()
plt.show(block=False)
