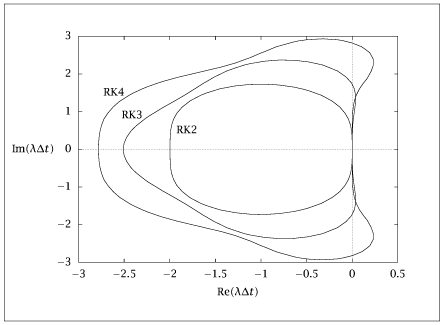
import numpy as np
import matplotlib.pyplot as plt
# Setting up the grid points
axisbox = [-4, 4, -4, 4]
xa, xb, ya, yb = axisbox
nptsx = 51
nptsy = 51
x = np.linspace(xa, xb, nptsx)
y = np.linspace(ya, yb, nptsy)
X, Y = np.meshgrid(x, y)
Z = X + 1j * Y
# Define the Runge-Kutta methods
def RK2(z):
return 1 + z + 1/2 * z**2
def RK3(z):
return 1 + z + 1/2 * z**2 + 1/6 * z**3
def RK4(z):
return 1 + z + 1/2 * z**2 + 1/6 * z**3 + 1/24 * z**4
# Evaluate R(z) inside axisbox
Rval2 = RK2(Z)
Rval3 = RK3(Z)
Rval4 = RK4(Z)
# Evaluate |R(z)| for finding the region of absolute stability
Rabs2 = np.abs(Rval2)
Rabs3 = np.abs(Rval3)
Rabs4 = np.abs(Rval4)
# Generate contours
cs2 = plt.contour(x, y, Rabs2.T, [1])
cs3 = plt.contour(x, y, Rabs3.T, [1])
cs4 = plt.contour(x, y, Rabs4.T, [1])
plt.close()
def get_contour_data(cs):
paths = cs.collections[0].get_paths()
v = paths[0].vertices
return v
c2 = get_contour_data(cs2)
c3 = get_contour_data(cs3)
c4 = get_contour_data(cs4)
# swap columns (not sure why this is needed: jbr)
c2[:, [0,1]] = c2[:, [1,0]]
c3[:, [0,1]] = c3[:, [1,0]]
c4[:, [0,1]] = c4[:, [1,0]]
plt.figure()
plt.plot(c2[:,0], c2[:,1])
plt.plot(c3[:,0], c3[:,1])
plt.plot(c4[:,0], c4[:,1])
plt.show(block=False)
# Save to RK_stability.dat file
with open('RK_stability.dat', 'w') as f:
np.savetxt(f, c2, fmt='%.8f', header="c2")
f.write('\n\n')
np.savetxt(f, c3, fmt='%.8f', header="c3")
f.write('\n\n')
np.savetxt(f, c4, fmt='%.8f', header="c4")
