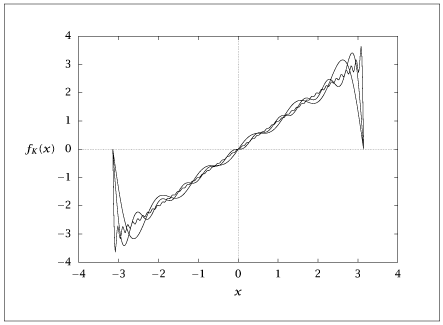
Figure 2.5:
Truncated trigonometric Fourier series approximation to f(x)=x, using K=5,10, 50. The wiggles get finer as K increases.
Code for Figure 2.5
Text of the GNU GPL.
main.py
1
2
3
4
5
6
7
8
9
10
11
12
13
14
15
16
17
18
19 | import numpy as np
import matplotlib.pyplot as plt
nxs = 301
x = np.linspace(-np.pi, np.pi, nxs)
nterms = [5, 10, 50]
u = np.zeros((len(nterms), nxs))
for i, nterm in enumerate(nterms):
for k in range(1, nterm + 1):
sign = (-1) ** k
un0 = -2 * sign / k
u[i, :] += un0 * np.sin(k * x)
plt.plot(x, u.T)
plt.show(block=False)
with open("Fourierx.dat", "w") as f:
np.savetxt(f, np.column_stack([x, *u]), fmt="%f")
|