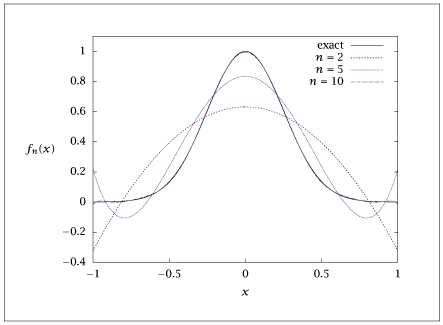
Figure 2.6:
Function f(x)=\exp \big (-8x^{2}\big ) and truncated Legendre-Fourier series approximations with n=2,5,10.
Code for Figure 2.6
Text of the GNU GPL.
main.py
1
2
3
4
5
6
7
8
9
10
11
12
13
14
15
16
17
18
19
20
21
22
23
24
25
26
27
28
29
30 | import numpy as np
import matplotlib.pyplot as plt
from scipy.special import legendre
nxs = 1000
x = np.linspace(-1, 1, nxs)
dx = 2 / (nxs - 1)
nterms = [2, 5, 10]
u = np.zeros((len(nterms), nxs))
ntermsmax = nterms[-1]
phi = np.zeros((ntermsmax + 1, nxs))
for m in range(ntermsmax + 1):
P = legendre(m)(x)
phi[m, :] = P * np.sqrt((2 * m + 1) / 2)
flist = np.exp(-8 * x**2)
for i in range(len(nterms)):
for k in range(nterms[i] + 1):
ck = np.dot(flist, phi[k, :]) * dx
u[i, :] += ck * phi[k, :]
plt.plot(x, flist, '-', x, u[0, :], '--', x, u[1, :], ':', x, u[2, :], '-.')
plt.legend(['exp(-8x^2)', 'n=2', 'n=5', 'n=10'])
plt.show(block=False)
table = np.column_stack( (x, flist, u.T) )
with open("LegendreGaussian.dat", "w") as f:
np.savetxt(f, table, fmt='%f', header="table")
|