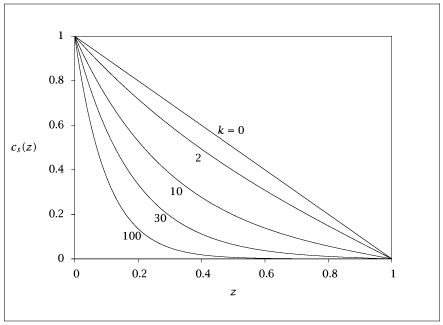
import numpy as np
import matplotlib.pyplot as plt
nzs = 100
z = np.linspace(0, 1, nzs)
kvec = np.array([0, 2, 10, 30, 100])
cs = np.zeros((len(z), len(kvec)))
for i in range(len(kvec)):
k = kvec[i]
if k == 0:
cs[:, i] = 1 - z
else:
cs[:, i] = np.sinh(np.sqrt(k) * (1 - z)) / np.sinh(np.sqrt(k))
plt.figure()
plt.plot(z, cs)
nk = 3
k = kvec[nk]
tvec = np.array([0, 0.001, 0.005, 0.01, 0.05, 0.1, 1.0])
nts = len(tvec)
nterms = 25
c = np.zeros((nzs, nts))
for j in range(nts):
t = tvec[j]
sum_ = np.zeros(nzs)
for n in range(1, nterms+1):
n2p2 = n**2 * np.pi**2 + k
term = (-1)**n * (n / n2p2) * np.sin(n * np.pi * (1 - z)) * np.exp(-n2p2 * t)
sum_ += term
c[:, j] = cs[:, nk] + sum_ * 2 * np.pi
plt.figure()
plt.plot(z, c)
plt.show(block=False)
# store data
store = np.column_stack((z, cs))
with open("csz.dat", "w") as f:
np.savetxt(f, store, fmt='%f', header='store')
