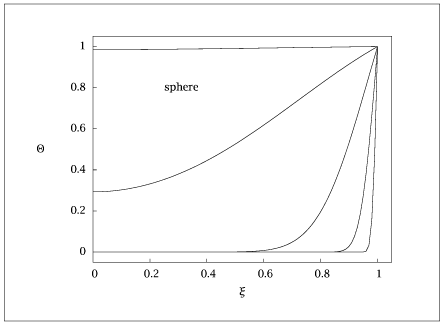
Figure 3.13:
Transient heating of slab, cylinder, and sphere.
Code for Figure 3.13
Text of the GNU GPL.
main.py
1
2
3
4
5
6
7
8
9
10
11
12
13
14
15
16
17
18
19
20
21
22
23
24
25
26 | import numpy as np
import matplotlib.pyplot as plt
nterms = 100
nrs = 100
r = np.linspace(0, 1, nrs).reshape(-1, 1)
tvec = np.array([0.0001, 0.001, 0.01, 0.1, 0.5])
Temp = np.zeros((nrs, len(tvec)))
sign = 1
for n in range(1, nterms + 1):
term = sign * np.sin(n * np.pi * r) / (n * np.pi * r) * np.exp(-(n * np.pi)**2 * tvec)
if r[0] == 0:
term[0, :] = sign * np.exp(-(n * np.pi)**2 * tvec)
Temp += term
sign = -sign
Temp = 1 - 2 * Temp
plt.figure()
plt.plot(r, Temp)
plt.show(block=False)
output = np.column_stack( (r, Temp) )
with open("transsph.dat", "w") as f:
np.savetxt(f, output, fmt='%f', header="output")
|