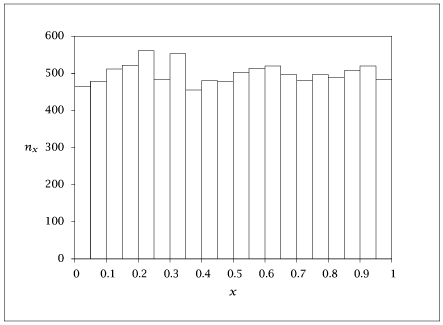
import numpy as np
import matplotlib.pyplot as plt
nsam = 10000
nsum = 10
x = np.random.rand(nsum, nsam)
y = np.sum(x, axis=0)
nbins = 20
plt.figure()
plt.hist(y, bins=nbins)
plt.show(block=False)
plt.figure()
plt.hist(x[0, :], bins=nbins)
plt.show(block=False)
nx, binsx = np.histogram(x[0, :], bins=nbins)
# make bar plot data for gnuplot
barx1 = np.kron(binsx,[1,1,1])[1:-1]
bary1 = np.append(np.kron(nx, [0, 1, 1]), 0)
ny, binsy = np.histogram(y, bins=nbins)
# make bar plot data for gnuplot
barx2 = np.kron(binsy,[1,1,1])[1:-1]
bary2 = np.append(np.kron(ny, [0, 1, 1]), 0)
data = np.column_stack( (barx2, bary2, barx1, bary1) )
# Save the data to 'cenlim.dat'
with open("cenlim.dat", "w") as f:
np.savetxt(f, data, fmt='%f', header="data")
