%
% show a Wiener process is rough at all time scales
% jbr, 12/6/2009
%
del = 1e-6;
nts = 1/del + 1;
time = (0:nts-1)'/(nts-1);
% reproducible random numbers
randn("seed",0);
% unit variance white noise
incr = [0; randn(nts-1,1)];
% integrated white noise, i.e. Wiener process
w = cumsum(incr);
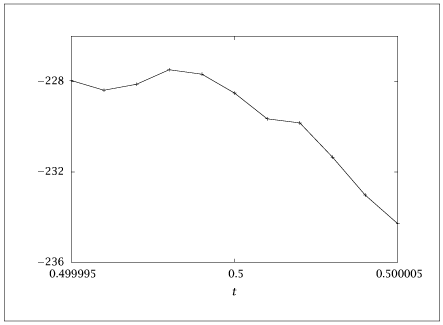
% make 6 plots at increasingly fine time scale;
% the y ranges for the boxes were chosen after looking at the plots;
% these will change if one changes the seed above
xbox = [0.45, 0.55; ...
0.495, 0.505; ...
0.4995, 0.5005; ...
0.49995, 0.50005; ...
0.499995, 0.500005; ...
0.5, 0.5];
ybox = [0, -500; ...
-220, -360; ...
-220, -290; ...
-225, -250; ...
-226, -236; ...
-229, -229];
middle = 1/(del*2) + 1;
for n = 1:6
figure()
x = xbox(n,:);
y = ybox(n,:);
left = middle - 1/(10^(n-1)*del*2);
right = middle + 1/(10^(n-1)*del*2);
ind = left:right;
box{n} = [x(1), y(1); x(1), y(2); x(2), y(2); x(2), y(1); x(1), y(1)];
plot(time(ind), w(ind), box{n}(:,1),box{n}(:,2))
tab = [time(ind), w(ind)];
save ('-ascii', sprintf ('wiener_%d.dat', n), 'tab');
end
boxdata = cell2mat(box);
save ('-ascii', 'wiener_box.dat', 'boxdata');
