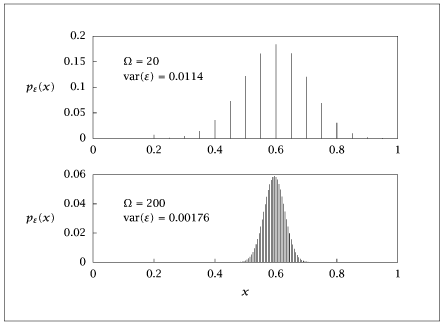
The equilibrium reaction extent's probability density for Reactions \ref {rxn:rxn2} at system volume \Omega =20 (top) and \Omega = 200 (bottom). Notice the decrease in variance in the reaction extent as system volume increases.
importnumpyasnpimportmatplotlib.pyplotaspltfromscipy.linalgimportexpmdefsimulate_system(Vol):x=np.array([1,5,0])*Volnmol=x[0]k=np.zeros(2)k[0]=1/Volk[1]=3extent=np.linspace(1,0,num=int(nmol+1))A=np.zeros((int(nmol+1),int(nmol+1)))foriinrange(int(nmol+1)):n=inu=nmol-na=nb=x[1]-nuc=nuA[i,i]=-(k[0]*a*b+k[1]*c)ifi>0:A[i,i-1]=k[1]*(c+1)ifi<nmol:A[i,i+1]=k[0]*(a+1)*(b+1)p=np.zeros(int(nmol+1))p[-1]=nmoldeltat=0.01tfinal=1time=np.arange(0,tfinal+deltat,deltat)Ad=expm(A*deltat)fortintime:p=Ad@pp=p/p.sum()*nmolpeq=p/nmoltable=np.column_stack((extent,peq))returntabletable_small=simulate_system(20)table_large=simulate_system(200)plt.figure()plt.plot(table_large[:,0],table_large[:,1],'^')plt.figure()plt.plot(table_small[:,0],table_small[:,1],'^')plt.show(block=False)withopen('prob_dis_scale.dat','w')asf:# First block: Mean square displacementnp.savetxt(f,table_small,fmt='%f',header="table_small")f.write("\n\n")np.savetxt(f,table_large,fmt='%f',header="table_large")