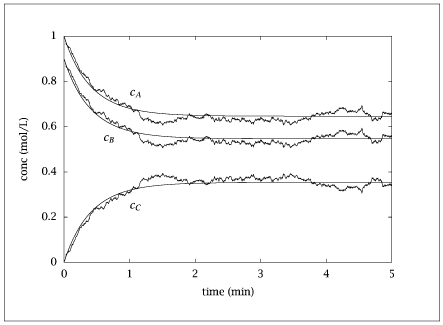
importnumpyasnpimportmatplotlib.pyplotaspltfromscipy.integrateimportsolve_ivpfromscipy.interpolateimportinterp1d# Parametersnmolec=400k1=1k2=1k=[k1/nmolec,k2]stoi=np.array([[-1,-1,1],[1,1,-1]]).T# stoichiometry matrixnrxs,nspec=stoi.shape# Initial conditions for three species A, B, Cx=np.zeros((3,nmolec*4+1))x[:,0]=[nmolec,0.9*nmolec,0]# A, B, C initial concentrationstime=np.zeros(nmolec*4+1)# Seed for reproducibilitynp.random.seed(0)# Gillespie algorithm simulationforninrange(nmolec*4):r=[k[0]*x[0,n]*x[1,n],k[1]*x[2,n]]rtot=sum(r)p=np.random.rand(2)tau=-np.log(p[0])/rtottime[n+1]=time[n]+tau# Determine which reaction occursrcum=0m=-1whilercum<=p[1]*rtot:m+=1rcum+=r[m]x[:,n+1]=x[:,n]+stoi[:,m]# Scale the resultsxscale=x/x[0,0]# Deterministic comparison using ODEca0,cb0,cc0=1.0,0.9,0.0timedet=np.concatenate(([0],np.logspace(-4,1,100)))p={'ca0':ca0,'cb0':cb0,'cc0':cc0,'k1det':k1,'k2det':k2}# Define the ODE functiondeff(t,x):ca=x[0]cb=ca-p['ca0']+p['cb0']cc=p['cc0']+p['ca0']-cadca_dt=-p['k1det']*ca*cb+p['k2det']*ccreturn[dca_dt]# Solve the ODEode_sol=solve_ivp(f,[timedet[0],timedet[-1]],[ca0],t_eval=timedet,method='LSODA')ca=ode_sol.y[0]cb=ca-ca0+cb0cc=cc0+ca0-ca# Interpolate deterministic results to match stochastic time pointsca_interp=interp1d(timedet,ca,kind='linear',fill_value="extrapolate")(time)cb_interp=interp1d(timedet,cb,kind='linear',fill_value="extrapolate")(time)cc_interp=interp1d(timedet,cc,kind='linear',fill_value="extrapolate")(time)# Prepare the table for savingtable=np.column_stack((time,xscale.T,ca_interp,cb_interp,cc_interp))# Save the data to a filewithopen("stochnon.dat","w")asf:np.savetxt(f,table,fmt='%f',header="time A_sto B_sto C_sto A_det B_det C_det")# Plot the resultsplt.figure()plt.plot(table[:,0],table[:,1:4],label=['Stochastic A','Stochastic B','Stochastic C'])plt.plot(time,ca_interp,label='Deterministic A',linestyle='--')plt.plot(time,cb_interp,label='Deterministic B',linestyle='--')plt.plot(time,cc_interp,label='Deterministic C',linestyle='--')plt.xlabel('Time')plt.ylabel('Concentration (scaled)')plt.legend()plt.title('Stochastic vs Deterministic Simulation')plt.axis([0,5,0,1])plt.grid()plt.show(block=False)