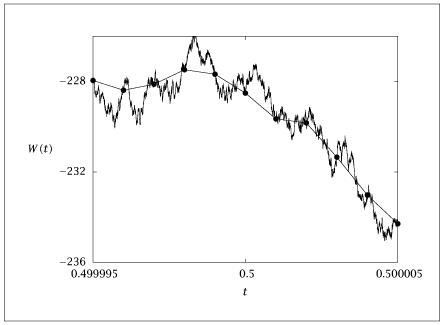
Sampling faster on the last plot in Figure \ref {fig:wiener}; the sample time is decreased to \Delta t = 10^{-9} and the roughness is restored on this time scale.
# [depends] wiener_6.dat# This py-file loads data file 'wiener_6.dat'.importnumpyasnpimportmatplotlib.pyplotasplt# restore the roughness to the finest time scale produced in wiener.m# Load datadata=np.loadtxt('wiener_6.dat')tdat=data[:,0]wdat=data[:,1]ndat=len(tdat)# Parametersnsam=1000del_=1/nsamnpts=(ndat-1)*nsamD=1# Set seed for reproducibilitynp.random.seed(0)# Generate unit variance random variables# then adjust the mean so the cumsum equals# the difference in consecutive wdat valuesraw2=np.sqrt(2*D*del_)*np.random.randn(nsam-1,ndat-1)wmean=np.diff(wdat)shiftmean=np.mean(raw2,axis=0)-wmean/(nsam-1)shift2=raw2-np.kron(np.ones((nsam-1,1)),shiftmean)shiftnoise=np.vstack((np.zeros(ndat-1),shift2))wmat=np.kron(np.ones((nsam,1)),wdat[:-1])+np.cumsum(shiftnoise,axis=0)w=wmat.ravel(order='F')deltat=np.kron(np.diff(tdat),np.linspace(0,1,nsam,endpoint=False))tmat=np.kron(tdat[:-1],np.ones(nsam))+deltattime=tmat.ravel()# The generated sequence (time, w) should pass through the data# (tdat,wdat) but display the Wiener process roughness between the data# pointsplt.plot(tdat,wdat,'-o',label='Original Data')plt.plot(time,w,label='Wiener Process')plt.legend()plt.show(block=False)# Combine fine and rough data into a single file and arrange as matrices for np.savetxtoriginal_data=np.column_stack((tdat,wdat))combined_data=np.column_stack((time,w))withopen('wexpand.dat','w')asf:np.savetxt(f,original_data,fmt='%.15f',delimiter='\t',header="[rough]")f.write("\n\n")np.savetxt(f,combined_data,fmt='%.15f',delimiter='\t',header="[fine]")