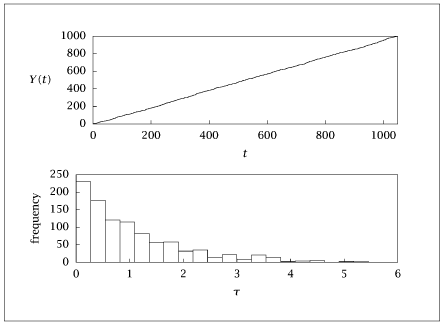
importnumpyasnpimportmatplotlib.pyplotasplt# Set the number of samples and random seed for reproducibilitynsam=1001np.random.seed(0)# Generate random samples for the Poisson processp=np.random.rand(nsam,1)tau=-np.log(p)time=np.concatenate(([0],np.cumsum(tau).flatten()))# Generate step plot (stairs in MATLAB)Y=np.arange(nsam+1)plt.figure()xx,yy=np.repeat(time,2)[1:-1],np.repeat(Y,2)[:-2]# Equivalent to stairs without the last elementplt.plot(xx,yy)plt.title('Poisson Process Stairs Plot')plt.xlabel('Time')plt.ylabel('Count')plt.grid(True)plt.show(block=False)# Plot histogram of tauplt.figure()nbins=20ntau,bins,_=plt.hist(tau,bins=nbins,edgecolor='black')# make bar plot data for gnuplotbarx=np.kron(bins,[1,1,1])[1:-1]bary=np.append(np.kron(ntau,[0,1,1]),0)plt.title('Histogram of Inter-arrival Times (tau)')plt.xlabel('Tau')plt.ylabel('Frequency')plt.grid(True)plt.show(block=False)# Prepare tables to save datatable1=np.column_stack((xx,yy))#table2=np.column_stack((barx,bary))# Save data in readable .dat format using fmt='%f'withopen('poissonlots.dat','w')asf:np.savetxt(f,table1,fmt='%f',header="table1")f.write("\n\n")np.savetxt(f,table2,fmt='%f',header="table2")