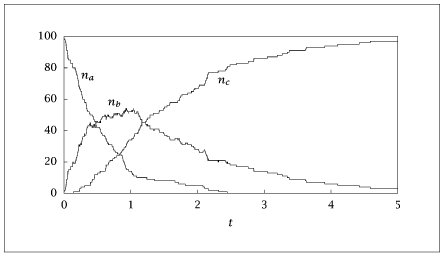
import numpy as np
import matplotlib.pyplot as plt
k = [2, 1]
stoi = np.array([[-1, 1, 0], [0, -1, 1]])
nrxs, nspec = stoi.shape
nsim = 200
time = np.zeros(nsim+1)
x = np.zeros((3, nsim+1))
x[:,0] = [100, 0, 0]
stoiT = stoi.T
time[0] = 0
np.random.seed(0)
for n in range(nsim):
r = np.array([k[0]*x[0,n], k[1]*x[1,n]])
rtot = r.sum()
p = np.random.rand(2)
tau = -np.log(p[0])/rtot
time[n+1] = time[n] + tau
m = sum(np.cumsum(r/rtot) <= p[1]) + 1
x[:,n+1] = x[:,n] + stoiT[:,m-1]
ts, xs = np.repeat(time, 2)[1:-1], np.repeat(x, 2, axis=1)[:,:-2]
table = np.column_stack([ts, xs.T])
# Save the data to a file in the corrected format
with open("stoch_small.dat", "w") as f:
np.savetxt(f, table, fmt='%f')
plt.plot(table[:,0], table[:,1:], label=['A', 'B', 'C'])
plt.legend()
plt.show(block=False)
