Molecular Dynamics of a Tethered Protein
Brad Spatola
CHE210D Spring 2009 Final Project
Summary
The system being investigated is the interaction between a bound protein molecule, modeled as 30 Lennard-Jones particles, and a surface. In order to examine the protein folding into the wall, the radius of gyration and protein end-to-end length were calculated and a molecular dynamics movie was recorded. Results indicate that the protein will fold into a tighter group at lower temperatures than at higher temperatures. In addition, once the protein approaches the wall, it will stay in a closely packed formation for the duration of the simulation run.
Background
The system being studied is a coarse-grained model of a 30 particle polypeptide structure tethered to a solid surface and the study of its interactions with both the solid surface and intra-molecular interactions within the chain itself. These physical phenomena are of interest because the system loosely represents the research objective of printing a protein onto a glass slide containing bacterial cells that specifically bind the protein. These glass slides are to be used in a diagnostic array to identify the presence of an autoimmune disease.
Simulation methods
A molecular dynamics simulation was used to study the trajectory of atomic positions as a function of time. The “protein” was modeled as a chain of Lennard-Jones atoms according to the following dimensionless potential energy function
![]()
where k, the force constant for harmonic bonds between adjacent atoms, is 3000 and r0, the equilibrium bond distance, is 1. For non-bonded pairwise interactions, the potential energy was cut in order to truncate all interactions separated by a cut length of greater than 2.5 and shifted to avoid any discontinuities in the potential energy function. The interaction of the chain particles with the wall was modeled as a 9-3 wall potential
![]()
where ρσsurface3 = 0.74 (assuming σsurface3= σchain3) and ε = 1.0 (in order to get the desired wall interaction intensity). These potential energy functions were summed together to achieve the total chain interactions. The system has constant NVE dynamics during the production period of the simulation after velocity rescaling is turned off.
To start the simulation the particles were initially placed in a stretched out chain at set z-positions but random x- and y-positions. This initial configuration was then energy-minimized to a local minimum by the conjugate gradient method. Next, the velocity Verlet algorithm is used to move the system forward in time. The algorithm computes the forces on each atom at a particular time point, updates the positions and partially updates the velocity using these forces, and then completes the velocity update by calculating new forces from the new positions. Finally, the Berendsen thermostat was used to rescale velocities in the system to the target temperature up until time=10 when velocity rescaling was turned off for the duration of the simulation (time=100).
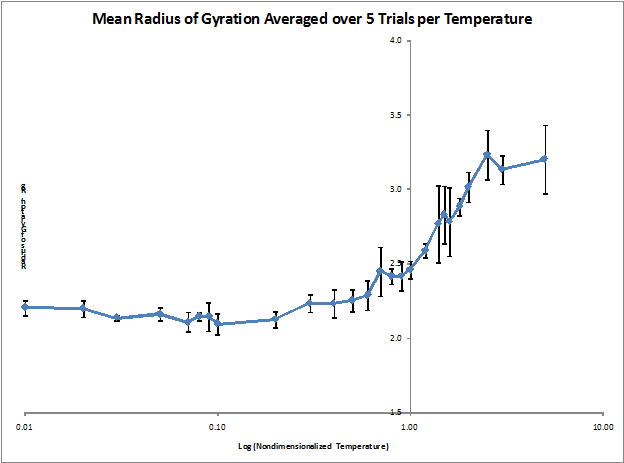
Figure 1. Mean radius of gyration as a function of temperature (averaged over 5 runs each)
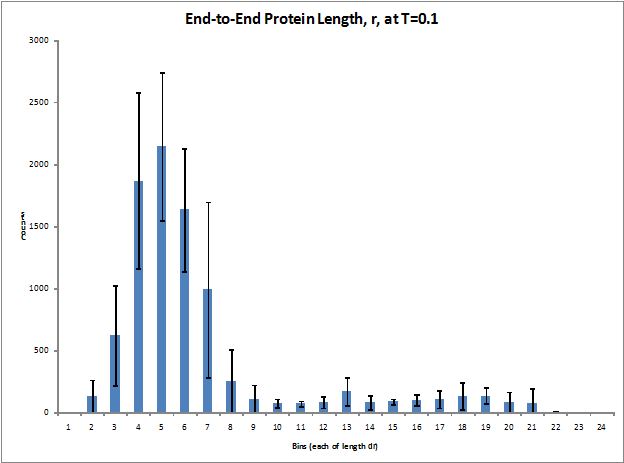
Figure 2. Histogram of end-to-end chain length of the protein (averaged over 7 runs)
Results and interpretation
The mean radius of gyration (Rg) was calculated for nondimensionalized temperatures ranging from 0.01 to 5.0 and five simulation runs were performed for each temperature in order to get an estimate of the statistical quality of the data. As shown in Figure 1, the mean Rg of the protein structure varies with temperature in a sigmoid curve fashion. This was expected as the protein should reach its maximally stretched dimensions at a certain temperature (nondimensionalized temperature of approximately 2.5) and level off. Figure 2 shows the distribution of the z-component separation distance between the first and last particles in the chain. This so called end-to-end protein length was examined from a minimum separation of zero up to the initial conditions of maximum separation. The histogram data was not collected until after rescaling was turned off so the protein was already significantly more compact than at its maximum initial length, which explains the distribution being shifted towards lower chain lengths.
The system appears to hesitate for approximately the first 100,000 integration steps, but once the folding begins, it folds quickly and the particles never return to a stretched out state. Figure 2 shows that the majority of the protein’s time after equilibration is spent in the lower third of possible end-to-end chain lengths. The hesitation before folding is most likely due to the velocity rescaling/equilibration time at the beginning of the simulation run. In addition, it can be concluded that the protein becomes more closely packed at lower temperatures than high temperatures.
A model deficiency is the loss of dynamics with the use of the Berendsen thermostat. However, the thermostat is turned off before Rg and chain length data collection begins and dynamics are once again preserved afterwards. Another aspect of the model that needs to be improved is the lack of specificity of the chain and wall. A more detailed description of each particle, such as hydrophobic/hydrophilic properties, could be added into the simulation as well as increasing the number of particles. This may also include the implementation of a “Go Model.” Also, a wall density or electrostatic distribution may be interesting to examine instead of just a mass of identical particles.
Movie
The movie shows a chain of 30 Lennard-Jones particles tethered to a wall of particles and its dynamic movement over a period of 600,000 time steps at a temperature of 1.2. Notice the collapse of the structure towards the wall and the evolution of the shape thereafter.