Figure A.9:

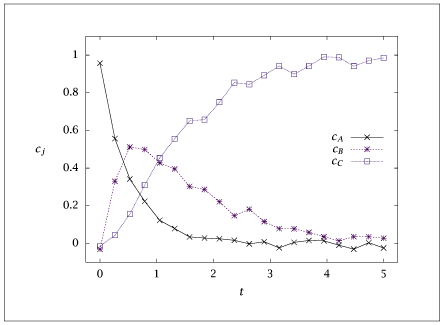
Measurements of species concentrations in Reactions A.9 versus time.

Code for Figure A.9

Text of the GNU GPL.

ABC_data.dat


 1
 2
 3
 4
 5
 6
 7
 8
 9
10
11
12
13
14
15
16
17
18
19
20
   0.000   0.957  -0.031  -0.015
   0.263   0.557   0.330   0.044
   0.526   0.342   0.512   0.156
   0.789   0.224   0.499   0.310
   1.053   0.123   0.428   0.454
   1.316   0.079   0.396   0.556
   1.579   0.035   0.303   0.651
   1.842   0.029   0.287   0.658
   2.105   0.025   0.221   0.750
   2.368   0.017   0.148   0.854
   2.632  -0.002   0.182   0.845
   2.895   0.009   0.116   0.893
   3.158  -0.023   0.079   0.942
   3.421   0.006   0.078   0.899
   3.684   0.016   0.059   0.942
   3.947   0.014   0.036   0.991
   4.211  -0.009   0.014   0.988
   4.474  -0.030   0.036   0.941
   4.737   0.004   0.036   0.971
   5.000  -0.024   0.028   0.985