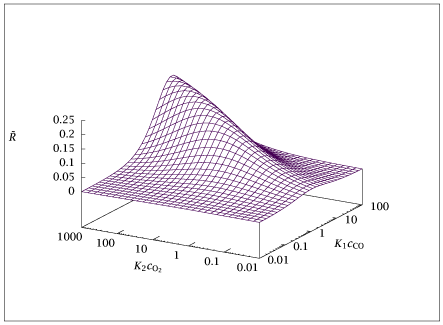
Figure 5.23:

Dimensionless CO_2 production rate versus dimensionless gas-phase CO and O_2 concentrations.

Code for Figure 5.23

Text of the GNU GPL.

main.m


 1
 2
 3
 4
 5
 6
 7
 8
 9
10
11
12
13
14
15
16
17
18
19
20
21
22
23
24
25
26
27
28
29
30
31
32
33
34
35
36
37
38
39
40
41
42
43
44
45
46
47
48
49
% Copyright (C) 2001, James B. Rawlings and John G. Ekerdt
%
% This program is free software; you can redistribute it and/or
% modify it under the terms of the GNU General Public License as
% published by the Free Software Foundation; either version 2, or (at
% your option) any later version.
%
% This program is distributed in the hope that it will be useful, but
% WITHOUT ANY WARRANTY; without even the implied warranty of
% MERCHANTABILITY or FITNESS FOR A PARTICULAR PURPOSE.  See the GNU
% General Public License for more details.
%
% You should have received a copy of the GNU General Public License
% along with this program; see the file COPYING.  If not, write to
% the Free Software Foundation, 59 Temple Place - Suite 330, Boston,
% MA 02111-1307, USA.
%
% Revised 7/24/2018


xisosamples = 30;
yisosamples = 30;
x = logspace(-2, 2, xisosamples)';
y = logspace(-2, 3, yisosamples)';

[xx,yy] = meshgrid(x,y);

zz = xx.*sqrt(yy) ./ ( (1 + xx + sqrt(yy)) ).^2 ;

file = fopen ('CO3d.dat', 'w');

for j = 1:yisosamples
    for i = 1:xisosamples
            fprintf (file, '%f %f %f\n', x(i), y(j), zz(j, i));
    end

    if (j < yisosamples)
        fprintf (file, '\n');
    end
end

fclose (file);

if (~ strcmp (getenv ('OMIT_PLOTS'), 'true')) % PLOTTING
    mesh (xx, yy, zz);
    set(gca,'XScale','log')
    set(gca,'YScale','log')
    % TITLE
end % PLOTTING