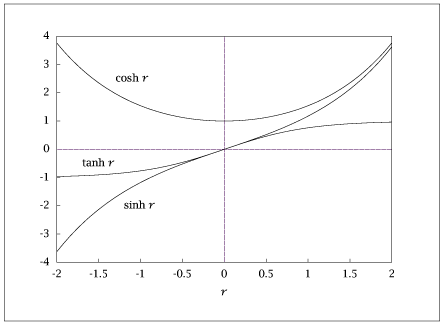
1 2 3 4 5 6 7 8 9 10 # Converted from hyperbolic.m - hyperbolic function plots import numpy as np from misc import save_ascii npts = 100 x = np.linspace(-2., 2., npts).reshape(-1, 1) y = np.column_stack([np.sinh(x), np.cosh(x), np.tanh(x)]) table = np.column_stack([x, y]) save_ascii('hyperbolic.dat', table)