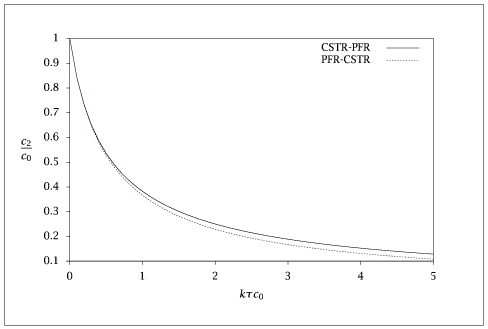
Figure 8.14:
Comparison of the effluent concentrations for the two cases shown in Figure~\ref {fig:pc_cp_schem}.
Code for Figure 8.14
Text of the GNU GPL.
main.m
1
2
3
4
5
6
7
8
9
10
11
12
13
14
15
16
17
18
19
20
21
22
23
24
25
26
27
28
29
30
31
32
33 | % Copyright (C) 2001, James B. Rawlings and John G. Ekerdt
%
% This program is free software; you can redistribute it and/or
% modify it under the terms of the GNU General Public License as
% published by the Free Software Foundation; either version 2, or (at
% your option) any later version.
%
% This program is distributed in the hope that it will be useful, but
% WITHOUT ANY WARRANTY; without even the implied warranty of
% MERCHANTABILITY or FITNESS FOR A PARTICULAR PURPOSE. See the GNU
% General Public License for more details.
%
% You should have received a copy of the GNU General Public License
% along with this program; see the file COPYING. If not, write to
% the Free Software Foundation, 59 Temple Place - Suite 330, Boston,
% MA 02111-1307, USA.
ktheta = linspace(0.1,10,100)';
c0 = 1;
cp = P(C(c0, ktheta), ktheta);
pc = C(P(c0, ktheta), ktheta);
table = [0 c0 c0;
ktheta cp pc];
save -ascii pc_cp_comp.dat table;
if (~ strcmp (getenv ('OMIT_PLOTS'), 'true')) % PLOTTING
plot (table(:,1), table(:,2:3));
% TITLE
end % PLOTTING
|
C.m
| function retval = C(x, ktheta)
retval = (-1+sqrt(1+4*x.*ktheta))./(2*ktheta);
|
P.m
| function retval = P(x, ktheta)
retval = x./(1+x.*ktheta);
|